The Studio 5000 Watch window is the fastest way to put fifteen scattered tags side by side while the machine runs. Scrolling three routines to check a step number and two interlocks wastes the five minutes you do not have when a line is down. This walkthrough covers building watch lists, writing values online, and the one limitation that fools people: the window shows samples, not every scan.
Menu paths are from Logix Designer v33 with a 1756-L83E. They are the same back to v21 and forward to v36.
What you need
| Item | Note |
|---|---|
| Studio 5000 Logix Designer | Major version must match the controller firmware major revision |
| A controller or the emulator | Logix Emulate works for practice, see Studio 5000 Logix Emulate |
| An online path | Set it under Communications → Who Active before anything below works |
| The project open | Named watch lists stay with the project, so work in the real file, not an upload you plan to discard |
Step 1: Go online and open the Watch window
- Communications → Who Active, select the controller, click Set Project Path.
- Click Go Online. Wait for the status bar to say the project matches the controller.
- View → Watch. The Watch window docks at the bottom of the workspace, next to the Errors and Search Results tabs.
- The pull-down at the top of the window reads Quick Watch. That is the scratch list, and it is where you start.
If the window opens somewhere awkward, drag its tab to the bottom edge and it re-docks. Studio 5000 remembers the layout per workstation, not per project.
Step 2: Add tags
Type them. Click the empty cell in the Name column and start typing. Autocomplete offers controller scoped tags first. Press Enter and the row fills in with data type, value and style.
Take a whole routine. Open the routine you are reading, then open the Quick Watch pull-down and pick that routine from the list. Every tag and parameter the routine uses lands in the window at once. Delete the rows you do not need and you have a watch list in under a minute, already in the order the logic uses them.
Expand what you added. Arrays and UDTs open with the plus sign on the left of the row. Adding Recipe[4] and expanding it beats adding eleven members by hand. UDT structure and naming are in UDT usage examples.
For a program scoped tag, type the scope in front of the name: Program:Line3_Fill.Step. Without the prefix the window looks in controller scope only and tells you the tag does not exist, which is a confusing message when you are staring at the tag in a routine. Opening the tag editor to check scope is covered in how to open the tag editor.
Step 3: Name the list instead of leaving it as Quick Watch
An unnamed Quick Watch is thrown away when Logix Designer closes. Named lists stay with the project, so build one per machine section.
- Click into the Quick Watch pull-down at the top of the Watch window and type a name over it:
Fill_Sequence,Infeed_Interlocks,Drive_Faults. Avoid spaces. - Press Enter. The name now appears in the pull-down alongside Quick Watch and any open routines.
- Add your tags. Order them the way the sequence runs, not alphabetically. Step number first, then the permissives, then the outputs.
- File → Save the project.
A saved list is a handover document. The next technician opens Fill_Sequence and sees the eleven tags that explain the machine, instead of guessing which of 4,000 tags matter.
Step 4: Read and write values online
The Value column updates while you are online. Useful columns next to it:
| Column | What it does |
|---|---|
| Value | Live value. Click it, type a new one, press Enter to write to the controller |
| Force Mask | Shows the forced value if a force is installed on that bit or element |
| Style | Decimal, Hex, Binary, Octal, ASCII, Float. Change it per row |
| Data Type | Confirms you grabbed the tag you thought you did |
| Description | The tag description from the database, so the list documents itself |
Two habits worth building. Set Style to Binary on status words such as a drive status DINT, because reading bit 7 out of a decimal number is a waste of a brain. And treat writing a value as a real change: typing a 1 into a Start_Cmd BOOL starts the machine, with no confirmation dialog and no force indicator to warn anyone else.
Writing values is not forcing. A written value gets overwritten by the next scan if any logic drives that tag, which is why people conclude the Watch window is broken. If an OTE writes the tag every scan, your entry lasts microseconds. Force it or find the rung.
Step 5: Know when the Watch window is lying to you
The Watch window polls the controller on a display refresh, not on the controller scan. Anything shorter than the refresh can happen between two reads and you will never see it.
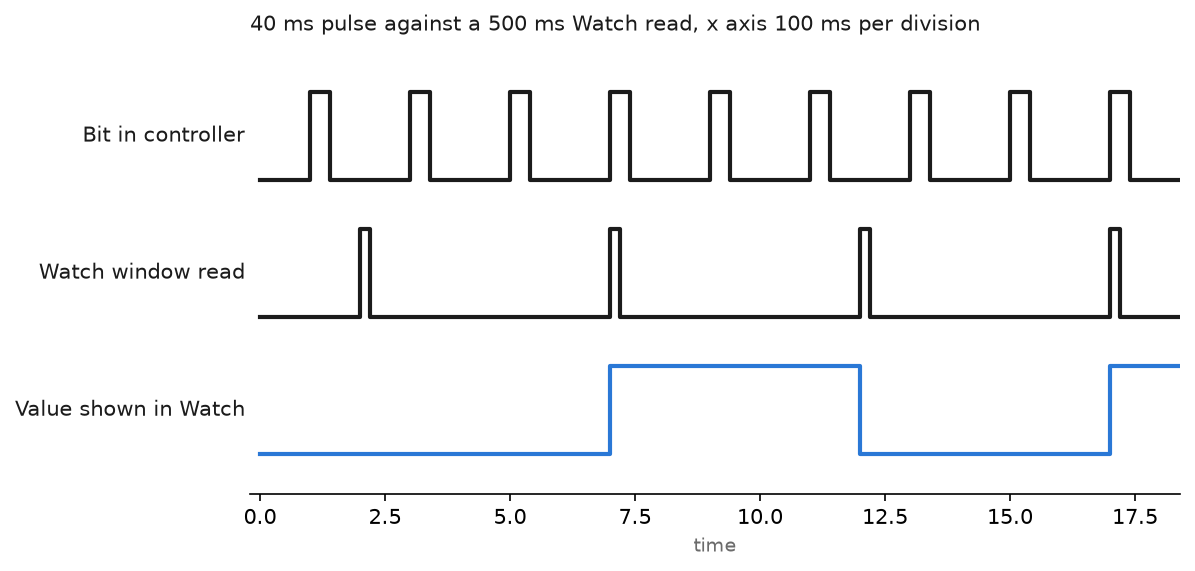
The chart shows a bit that pulses for 40 ms on every machine cycle, and a Watch window that reads roughly twice per second. Three pulses out of four leave no trace. The bit is fine, the tool is fine, the sample rate is not.
Two ways out. Use a trend, which is described below. Or latch the event in logic so a slow read still finds it:
(* Catch a pulse the Watch window is too slow to sample *)
(* Put this in a routine that runs every scan *)

IF Step_Done AND NOT Step_Done_Last THEN
    Step_Done_Count := Step_Done_Count + 1;
    GSV(WallClockTime, , DateTime, Step_Done_Stamp[0]);
    Step_Done_Latch := 1;
END_IF;

Step_Done_Last := Step_Done;

(* clear it from the Watch window by writing 1 to Step_Done_Reset *)
IF Step_Done_Reset THEN
    Step_Done_Latch := 0;
    Step_Done_Reset := 0;
END_IF;
Add Step_Done_Count, Step_Done_Latch and Step_Done_Stamp to the watch list. Now a 40 ms event leaves a counter and a timestamp you can read at your own pace. The first scan bit is useful for clearing counters like this on a restart, see PLC first scan bit.
Watch, Trend and Cross Reference do three different jobs
| Tool | Answers | Keeps history | Where |
|---|---|---|---|
| Watch window | What is this value right now | No | View → Watch |
| Trend | What did these values do over the last two minutes | Yes, in the chart buffer | Right-click Trends → New Trend |
| Cross Reference | Who writes this tag and from where | Not applicable | Right-click a tag → Cross Reference, or Ctrl+E |
Reach for the Trend when the question has the word “when” in it. Sample periods of tens of milliseconds are available, the chart holds history, and you can leave it running while you go get a coffee. Setup is in PLC trend chart settings and monitoring and trend page usage and tag history.
Reach for Cross Reference when a value is wrong rather than late. Two OTEs writing the same tag in different routines is invisible in the Watch window and obvious in the cross reference list.
Field notes: what actually goes wrong
The value that would not stay. An engineer wrote a setpoint into a Watch window cell on a palletiser, watched it revert, and wrote it again. Four times. A rung in a recipe routine was copying the recipe value into that tag every scan. Cross Reference found it in ten seconds. Writing into a tag that logic owns is always a losing fight.
Quick Watch as a handover. A night shift technician built a nine tag list in Quick Watch to chase a jam and left the laptop open. Day shift used it, added two tags, and lost the whole thing at lunch when somebody closed Logix Designer to reboot the laptop. Typing a name into the pull-down costs ten seconds and removes the problem.
Watching an alias and blaming the field. A watch list showed Infeed_PE at 0 while the photo eye was clearly blocked. The tag was an alias pointing at Local:4:I.Data.3, and the sensor had been rewired to point 5 during a panel change months earlier. The Alias For column in the tag monitor would have shown it. Check what the tag actually points to before you send an electrician to the sensor.
Forces hiding in plain sight. A forced input reads as its forced value everywhere, including in the Watch window. The Force Mask column and the forces indicator on the online bar are the only clues. Read the force list on every visit, as described in advanced PLC troubleshooting.
Frequently asked questions
Where is the Watch window in Studio 5000?
View → Watch. It docks at the bottom of the workspace with the Errors and Search Results tabs. It opens offline too, but the Value column only means something while you are online.
What is the difference between Quick Watch and a named watch list?
Quick Watch is the unnamed scratch list, gone when Logix Designer closes. Type a name into the pull-down and the same list becomes a named one that stays with the project until someone deletes it.
Why does my tag show as not found?
It is program scoped and you typed the bare name. Use Program:<ProgramName>.<TagName>.
Does the Watch window record history?
No. It shows the value at the last read. For history use a trend, or latch the event in logic and watch the latch.
Can I watch tags on a second controller at the same time?
Not in one list. Watch lists belong to one project. Open the second project in another Logix Designer instance and go online there.
Next step
Build one named watch list for the machine you support most, with the sequence step, the permissives that stop it, and the fault word in binary style. Save it into the project. Then add a trend on the same tags, following PLC trend chart settings and monitoring, so the next intermittent fault leaves evidence instead of a story.