Major fault Type 6 Code 1 means a task watchdog expired, and on a ControlLogix that watchdog defaults to 500 ms. The controller has been keeping the number that explains it all along: Max Scan Time and Last Scan Time sit on the Monitor tab of the task properties in microseconds, and a GSV puts the same values on an HMI screen. Here is how to read them on a ControlLogix and on an S7-1500, what the phases of a scan actually cost, and the four things that blow it up.
What one scan is made of
A scan is four pieces of work repeated forever. Input image update, program execution, output image update, then whatever the operating system needs for communications, online edits and housekeeping.
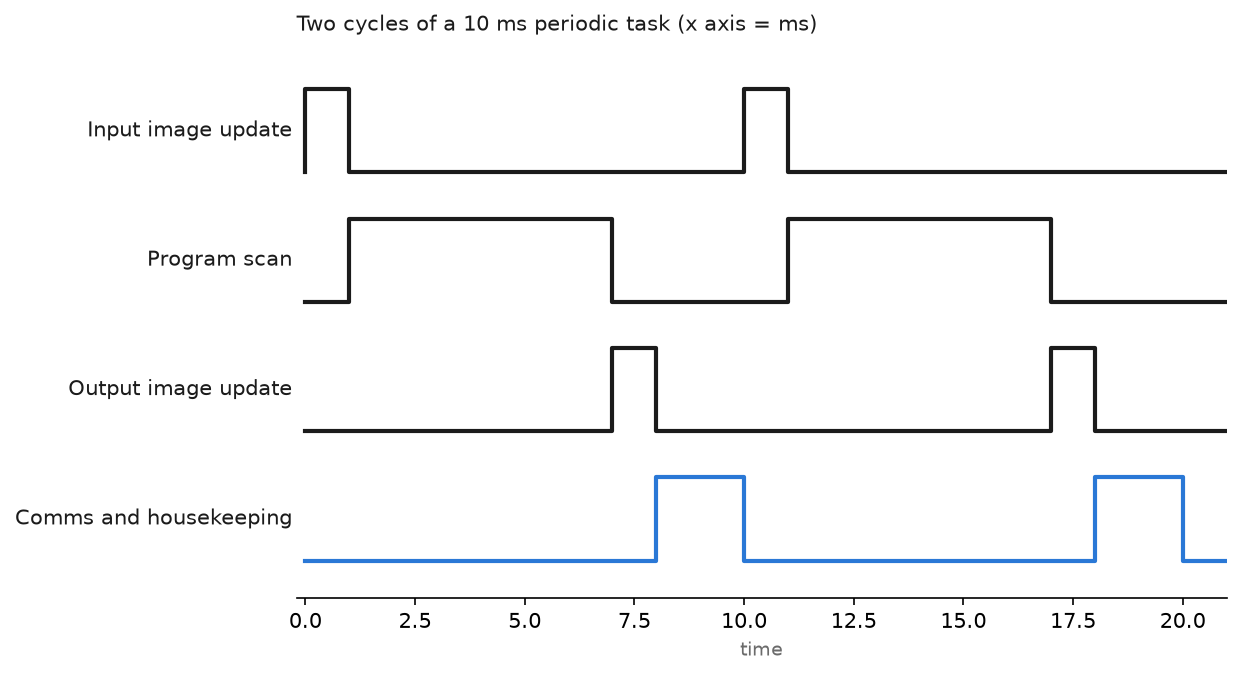
The chart shows a 10 ms periodic task. The program itself runs about 6 ms, the image updates are short, and the rest of the window belongs to the system. That leftover matters. If the program grows past 10 ms the task has nowhere to go.
One warning for Logix users. On ControlLogix and CompactLogix the physical I/O does not move at the boundaries of your scan. Modules produce and consume at their configured RPI, asynchronously to the task, so a 20 ms RPI on a 1756-IB16 means an input bit can be up to 20 ms old no matter how fast the program runs. Siemens process images on the S7-1200 and S7-1500 do update at the cycle boundary of OB1, which is why the two platforms feel different when you chase a fast event.
Read the numbers on a ControlLogix
The controller stores the last and the worst scan for every task.
- In the Controller Organizer right-click the task, for example
MainTask, and choose Properties. - Open the Monitor tab. Max Scan Time and Last Scan Time are shown in microseconds. Max Interval and Min Interval tell you how far the period actually drifted.
- Press Reset Max after any change, otherwise you are reading a number from last Tuesday.
To put the same values on an HMI screen, pull them with GSV:
(* Structured Text, any routine in the task you want to watch *)
GSV(TASK, MainTask, LastScanTime, Scan_Last_us);
GSV(TASK, MainTask, MaxScanTime,  Scan_Max_us);
GSV(TASK, MainTask, OverlapCount, Task_Overlaps);

Scan_Last_ms := Scan_Last_us / 1000.0;
Scan_Max_ms  := Scan_Max_us  / 1000.0;

IF Scan_Max_ms > 0.6 * Task_Watchdog_ms THEN
    Scan_Warning := 1;
END_IF;
OverlapCount is the one people forget. On a periodic task it counts how many times the task was still running when its next trigger arrived. Any value above zero means the period is too short for the code inside it.
The watchdog itself is on the Configuration tab of the same dialog and defaults to 500 ms. Blow past it and the controller takes a major fault, Type 6 Code 1, and drops to Program mode. Fault types and what to do with them are listed in ControlLogix major faults and fault codes.
Read the numbers on an S7-1500
- Go online, open Online and diagnostics on the CPU, then Diagnostics → Cycle time. You get shortest, current and longest cycle plus the configured limits.
- The limits themselves live in Device configuration → CPU properties → Cycle. Cycle monitoring time defaults to 150 ms.
- If a cycle exceeds that time the CPU calls OB80, the time error interrupt. With no OB80 in the project the CPU goes to STOP, and the diagnostic buffer records the cycle time exceeded entry with the actual value.
A Minimum cycle time setting is available on the same page. Use it when you want a stable, predictable OB1 period instead of a program that runs as fast as it can.
Typical numbers worth comparing against
| Controller and task | Program size | Typical scan | Comment |
|---|---|---|---|
| CompactLogix 5380 (5069-L320ER), continuous | 12 routines, 600 rungs | 4 to 7 ms | Normal machine control |
| ControlLogix 1756-L83E, 10 ms periodic | Motion and interlocks | 2.8 ms | Leaves 70 percent of the window free |
| ControlLogix 1756-L83E, continuous | 40 routines plus 30 MSG blocks | 45 to 120 ms | Message instructions cause the spread |
| S7-1214C, OB1 | 300 networks LAD | 6 to 9 ms | Well inside the 150 ms monitor |
| S7-1516, OB1 with recipe handling | SCL loops over 2000 elements | 12 to 55 ms | Loop count drives the spread |
Compare the worst case against the watchdog, not the average. A loop that averages 8 ms and peaks at 480 ms is one added routine away from a line stop.
Cut it down
- Move slow, occasional work out of the fast path. Recipe transfers, report building and data logging belong in a 1 second periodic task, not in
MainTask. - Cache message instructions. In Logix an uncached MSG opens and closes a connection every time it fires. Tick Cache Connections on the Communication tab of the MSG configuration and keep the total under the connection limit of the bridge module.
- Break big array work into slices. A COP of 40000 DINTs in one scan is one long blocking operation. Copy 2000 per scan with an index and let it finish over twenty scans.
- Raise the System Overhead Time Slice only when you need it, and only on controllers where it applies. On a 1756-L7x or earlier it defaults to 10 percent and trades continuous task time for online edits and HMI polling. The 1756-L8x and 5069-L3xx families run communications on a separate core, so this setting is not even on the Controller Properties dialog there.
- Check first scan work. Logic that only needs to run once belongs behind the first scan bit, described in PLC first scan bit, rather than running forever with a condition in front of it.
Field notes
The COP that faulted the controller. A packaging line ran a 1756-L71 with a 500 ms watchdog. An engineer added a routine that copied a 40000 element DINT array into a UDT for an OPC client. The download went fine, the line ran for four hours, then faulted with major fault Type 6 Code 1 during a product change when a second routine ran in the same scan. Fix was the slicing approach above, 2000 elements per scan. Max scan time came back to 61 ms.
Periodic task starving the continuous task. A 2 ms periodic task for a high-speed reject gate was using 1.4 ms per execution, so 70 percent of the processor. The continuous task, which held the HMI handshakes, went from 30 ms to over 300 ms and the operator screens felt dead. Nothing faulted, which made it worse to diagnose. OverlapCount on the fast task was zero, the clue was Max Interval on the continuous task. We moved the gate logic to a 5 ms period and dropped its scope to the two rungs that actually needed it.
Modbus poll inside OB1. An S7-1516 read six energy meters with MB_CLIENT called directly in OB1 with no throttling. Cycle time went from 11 ms to 190 ms whenever one meter stopped answering and the block waited on its timeout. The CPU stopped with a cycle time exceeded entry in the diagnostic buffer. Moving the meter polling to a 500 ms cyclic interrupt OB, one meter per call, fixed it permanently.
A scan time that was fine and an input that was not. An operator complained that a photo-eye missed parts. Scan time was 4 ms. The 1756-IB16 had an RPI of 32 ms and the input filter was set to 8 ms. The program never saw the pulse. Scan time was the wrong suspect, and general fault hunting like this is collected in PLC troubleshooting.
Frequently asked questions
What is a good scan time?
Whatever is short enough for your fastest signal and comfortably under the watchdog. For discrete machine control, anything under 20 ms with a peak below half the watchdog is healthy.
What is the difference between scan time and cycle time?
They describe the same loop. Rockwell writes about task scan time, Siemens writes about CPU cycle time. On a periodic task the scan time is the work and the period is the cycle, so the two are not equal.
Does adding an HMI slow the PLC down?
It adds communication load, which competes for the same processor. On Logix that shows up through the system overhead time slice. Reducing HMI poll rates on screens nobody is watching is the cheapest fix.
Why does my scan time change every time I look at it?
Conditional logic. Rungs behind a false condition still get evaluated but their instructions do not execute, and loops with variable trip counts cost different amounts on different scans. Use the maximum, not the last value.
Will a faster controller fix a long scan?
Sometimes. A 1756-L83E is meaningfully faster than a 1756-L71 on the same code. It will not save you from a blocking 40000 element copy, because that is an algorithm problem.
Next step
Once you can see the scan time, put it on a screen so it stops being a mystery during a breakdown. Timing and counting instructions behave differently on periodic and continuous tasks, and the details are in timer and counter instructions. For the Siemens side, the diagnostic buffer entries that follow a cycle overrun are decoded in Siemens S7 PLC error codes and causes/solutions.