The whole footprint of an IIoT project on a 1756-L73 that has run untouched for nine years can be one outbound TCP session on port 8883. A gateway reads the tags, publishes them over MQTT with Sparkplug B, and buffers to local disk when the link goes down; the control network gets no inbound rule, no public address and no write path back into the controller. Settle that before anyone picks a broker, because it is the part IT asks about first.
What follows is the build I use: KEPServerEX or Ignition Edge on a small box on the plant network, MQTT with Sparkplug B to a broker, and no path back into the controller until somebody signs for it.
What you need
| Item | Notes |
|---|---|
| Controller | Any PLC with an Ethernet port and an OPC or native driver. A 1756-L73 at firmware 20 is fine |
| Edge gateway | Ignition Edge with MQTT Transmission, KEPServerEX with the IoT Gateway plug-in, or a SIMATIC IOT2050 running your own client |
| Broker | Mosquitto, HiveMQ or EMQX on site, or AWS IoT Core and Azure IoT Hub in the cloud |
| Certificates | TLS on the broker. Self-signed works for a pilot, a real CA for production |
| Firewall rule | Outbound 8883 from the gateway only. Nothing inbound, ever |
| Disk on the gateway | For store and forward. Size it for the longest outage you can imagine, then double it |
Decide what to send and what never leaves the plant
Start from the question the dashboard is meant to answer, then work backwards to the tags. A list built the other way round always ends up with 3,000 points and no insight.
| Class | Send it | How often |
|---|---|---|
| Production counters | Yes | On change |
| Machine state and downtime reason | Yes | On change |
| Process values for trending | Yes, with a deadband | On change past deadband, plus a heartbeat every 60 s |
| Energy and utilities | Yes | Every 15 to 60 s |
| Alarm conditions | Yes, as conditions | On change |
| Motion setpoints at 1 ms | No | Keep it in the controller |
| Safety status as a control input | No | Hardwire it |
| Operator names and badge numbers | No | Personal data leaving the plant needs a different conversation |
| Raw recipe contents | Usually not | That is the plant’s process knowledge |
The rule I hold to is that nothing on the far side of the broker gets to change the machine. Read-only for the first year. Write access is a separate project with its own risk assessment, and by then you will know whether anybody actually uses the dashboard.
Pick the gateway before you pick the cloud
Ignition Edge IIoT. OPC UA client, tag historian, and Cirrus Link MQTT Transmission for Sparkplug B. Store and forward to local disk is built in. Costs the most, does the most.
KEPServerEX with the IoT Gateway plug-in. If you already run Kepware for an HMI or a historian, the MQTT client agent is a plug-in on the server you have. Channel setup is in Kepware channel configuration, and the background is in what is Kepware OPC.
SIMATIC IOT2050 or similar small Linux box. Cheapest, most work. You write the client, you own the buffering, you own the patching. Reasonable for a pilot on one machine, painful across thirty.
Whichever you pick, the gateway sits on the plant network and talks outbound only. It is not a jump host and it does not get a public address.
Use Sparkplug B rather than raw MQTT topics
Plain MQTT gives you a topic and a byte array. Everything above that is a convention you invent and then have to document. Sparkplug B is that convention, written down, with the state handling already solved.
The topic structure is fixed:
spBv1.0/<group_id>/<message_type>/<edge_node_id>[/<device_id>]

spBv1.0/Plant2/NBIRTH/GW-Line4              gateway comes online
spBv1.0/Plant2/DBIRTH/GW-Line4/Filler       device announces its full metric list
spBv1.0/Plant2/DDATA/GW-Line4/Filler        changed metrics only
spBv1.0/Plant2/DDEATH/GW-Line4/Filler       device lost
spBv1.0/Plant2/NDEATH/GW-Line4              registered as the MQTT Last Will
Three things come out of that for free. The NDEATH message is registered with the broker as the Last Will at connect time, so if the gateway drops off a cellular link, every subscriber finds out within the keepalive interval instead of staring at a stale number. The BIRTH message carries the complete tag list with data types, so a consumer that joins late knows the whole model without a separate configuration file. And DATA messages carry only what changed.
The payload is Google Protocol Buffers on the wire. Decoded, one DDATA looks like this:
{
  "timestamp": 1757740812431,
  "seq": 47,
  "metrics": [
    { "name": "Line4/Filler/CountGood",  "alias": 11,
      "timestamp": 1757740812430, "dataType": "Int32",  "value": 184213 },
    { "name": "Line4/Filler/StateCode",  "alias": 13,
      "timestamp": 1757740812430, "dataType": "Int16",  "value": 4 },
    { "name": "Line4/Filler/ReasonCode", "alias": 14,
      "timestamp": 1757740812430, "dataType": "Int16",  "value": 22 },
    { "name": "Line4/Filler/Head1_Temp", "alias": 21,
      "timestamp": 1757740812430, "dataType": "Float",  "value": 168.4 }
  ]
}
The seq number increments 0 to 255 and wraps. A gap means the subscriber missed a message and should ask for a rebirth rather than trusting what it has. After the BIRTH, metrics can be sent by alias alone, which is how a payload stays small on a metered SIM.
Model the tags in the controller, not in the gateway
Build a UDT in the PLC for the machine, one instance per device, and let the gateway map the structure straight through. Naming a metric Line4/Filler/Head1_Temp in the gateway while the controller calls it N7_43 gives you a translation table that nobody maintains.
If the structure lives in the controller, adding a second filler is a copy of the UDT instance and one line in the gateway config. UDT mechanics are in user defined datatype UDT usage examples, and the same structure makes the SCADA side easier as described in SCADA integration with PLC.
Set deadbands and turn on store and forward
Report by exception only helps if the exception threshold is sensible. An analog input sitting on the boundary between two counts will publish thousands of times an hour with no deadband at all.
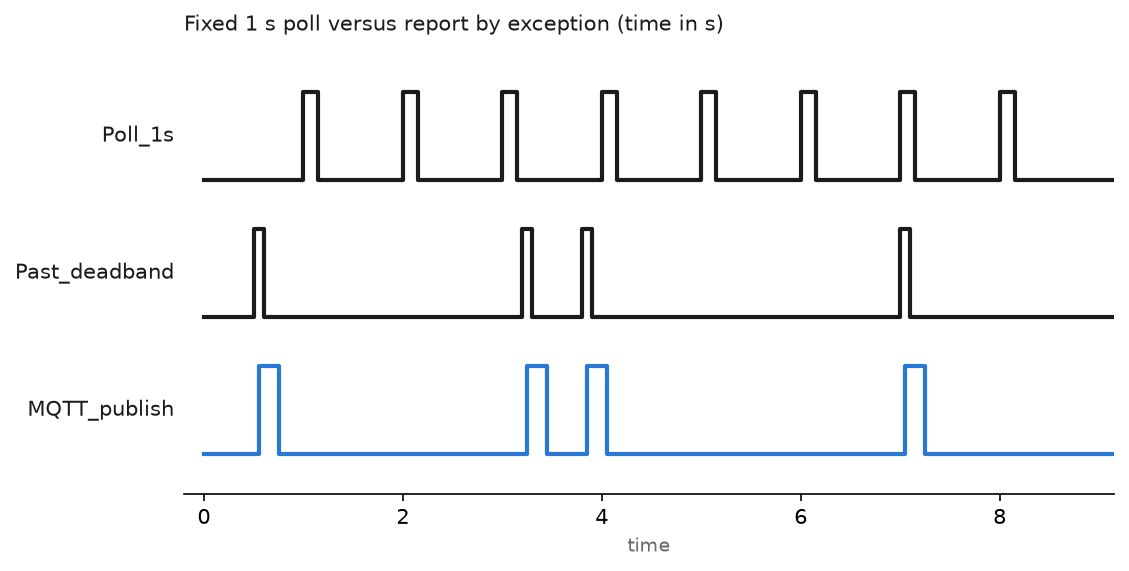
Start with a deadband of about one percent of span on analog values, exact change on integers and booleans, and a periodic republish every 60 seconds so a consumer can tell a quiet tag from a dead one. Then look at the broker’s message rate after a week and adjust.
Store and forward is the part people switch on after the first outage. Set it before go-live: buffer to disk, not to RAM, and confirm the behaviour by pulling the network cable for ten minutes and watching the history flush on reconnect. Check that the replayed messages keep their original timestamps. A gateway that stamps them at replay time turns a two hour outage into a two hour spike.
Security, kept to what actually matters
- Outbound only. The gateway initiates the TCP session to the broker on 8883. No inbound rule exists.
- TLS with certificate validation switched on. Turning verification off to make a pilot work is how it ships.
- One credential per gateway, not one shared across the plant. Revoking a single machine should be possible.
- The broker’s access control list restricts each gateway to publish on its own group and node topics and nothing else.
- No
NCMDorDCMDhandling in the gateway until write access is deliberately commissioned. - Put the gateway in the patch cycle on day one. It is a computer and it will need updates.
Field notes: what actually goes wrong
The cellular bill. A remote pump station published 40 analog tags every second with no deadband. The SIM plan was 500 MB a month and it ran out on the ninth day. Deadbands plus a 60 second heartbeat brought it under 40 MB with no loss of useful detail. Sparkplug aliases after the birth message took another slice off.
Timestamps from the wrong clock. Dashboard trends had every point stacked at the same instant after a reconnect. The gateway was stamping metrics on publish instead of carrying the timestamp from the OPC read. Where the driver supplies a source timestamp, use it, and keep the gateway clock on NTP so the two agree.
Rebirth storm. A broker restart made 60 edge nodes reconnect at the same second and publish full BIRTH payloads. The subscribing application queued for four minutes and two nodes timed out and reconnected, which made it worse. Stagger the reconnect with a random backoff. Most gateways expose this as a jitter setting and it defaults to none.
A tag list built from the HMI. An integrator exported every tag the HMI displayed, about 2,600 of them, and pointed the gateway at the lot. The controller’s CPU load went up by a measurable amount and the dashboard still answered no useful question. We cut it to 34 tags per machine and the project got approved for the next line.
Frequently asked questions
Can the PLC speak MQTT directly?
Some can. Newer Siemens and Opto 22 controllers have MQTT client blocks, and there are AOIs for Logix. It removes a box and adds a maintenance burden to the controller, including certificate expiry. For a plant with mixed vintages, a gateway ages better.
MQTT or OPC UA for this?
OPC UA is a session between two known endpoints and it suits a plant floor client. MQTT is publish and subscribe through a broker, which suits many consumers and unreliable links. Most sites run both, with OPC UA inside the plant and MQTT outward. See OPC for PLC integration.
Which MQTT QoS should I use?
Sparkplug decides it for you, and not the way intuition suggests. Under Sparkplug 3.0.0 the BIRTH and DATA messages are published at QoS 0 with retain false, because the sequence number already tells a consumer it has missed something and a lost message is cheaper to detect than to redeliver out of order. The exceptions are the NDEATH, which is registered as the connection’s will at QoS 1 so the broker publishes it when the gateway disappears, and the host application’s STATE message, which is QoS 1 and retained. Read the specification before you change any of these: a broker configured against it will be rejected by a conformant host. QoS 2 costs a four-part handshake per message for a guarantee the seq number already gives you.
Do I need a cloud at all?
No. An on-premises broker and a local dashboard answer most questions and never leave the site. Add the cloud when somebody outside the plant genuinely needs the data.
How do I prove the numbers before anyone builds a report on them?
Pull the same tags into a spreadsheet for a shift and compare against the operator screen. How to get data from PLC to Excel covers that, and it usually catches a scaling error before the dashboard does.
Next step
Start with one machine, thirty tags and an on-site broker. Get a week of clean data, check it against what the line actually produced, then add machines. If you want to see the same values on the plant floor first, PLC trend chart settings and monitoring builds the local trend that makes the remote dashboard easy to defend.