200 tags at 100 ms is 173 million rows a day, about 6 GB, and 2.2 TB in a year. Put a deadband on the same 200 tags and the year comes in somewhere between 4 and 25 GB, with nothing in it anyone would miss. That arithmetic comes before the tool choice, and it is what this page is built around: picking the rate and the retention from the question you want answered, buffering the rows in the controller so a Tuesday night SQL reboot leaves a backfill instead of a gap, and reaching the data from outside the plant without forwarding port 44818 to the internet.
Examples use Studio 5000 v33 with a 1756-L83E, FactoryTalk View SE 12, KEPServerEX 6 and SQL Server 2019.
Decide what the log is for before you pick a tool
| Purpose | Typical rate | Retention | Where it belongs |
|---|---|---|---|
| Fault forensics, catching an intermittent | 100 ms to 1 s | 2 to 7 days, rolling | Ring buffer in the controller, or a trend |
| Process history and tuning | 1 s to 10 s | 1 to 2 years | Historian or SQL |
| OEE, downtime, counts | On event | 3 to 5 years | SQL, feeding a report |
| Quality records and batch reports | On event plus 1 s during the batch | 7 to 10 years, regulated | SQL with a validated backup |
| Energy and utilities | 1 to 15 minutes | 3 years | SQL or the site energy system |
| Condition monitoring, vibration and current | 10 ms bursts on trigger | 30 days | Edge device, not the PLC |
Fault forensics at 1 s is useless for a 40 ms interlock, and energy data at 1 s is 900 times more data than anybody needs.
Do the retention arithmetic before the first tag
A row with a timestamp, a tag id and a REAL costs roughly 30 to 40 bytes in SQL Server once indexes are counted. Run the numbers.
| Setup | Rows per day | Raw size per day | Per year |
|---|---|---|---|
| 50 tags at 1 s | 4.3 million | about 150 MB | about 55 GB |
| 200 tags at 1 s | 17.3 million | about 600 MB | about 220 GB |
| 200 tags at 100 ms | 173 million | about 6 GB | about 2.2 TB |
| 200 tags, change based with deadband | 200 thousand to 2 million | 10 to 70 MB | 4 to 25 GB |
Change based logging with a deadband is the single biggest win available. A tank level that moves 0.2 percent per minute does not need 86,400 rows a day.
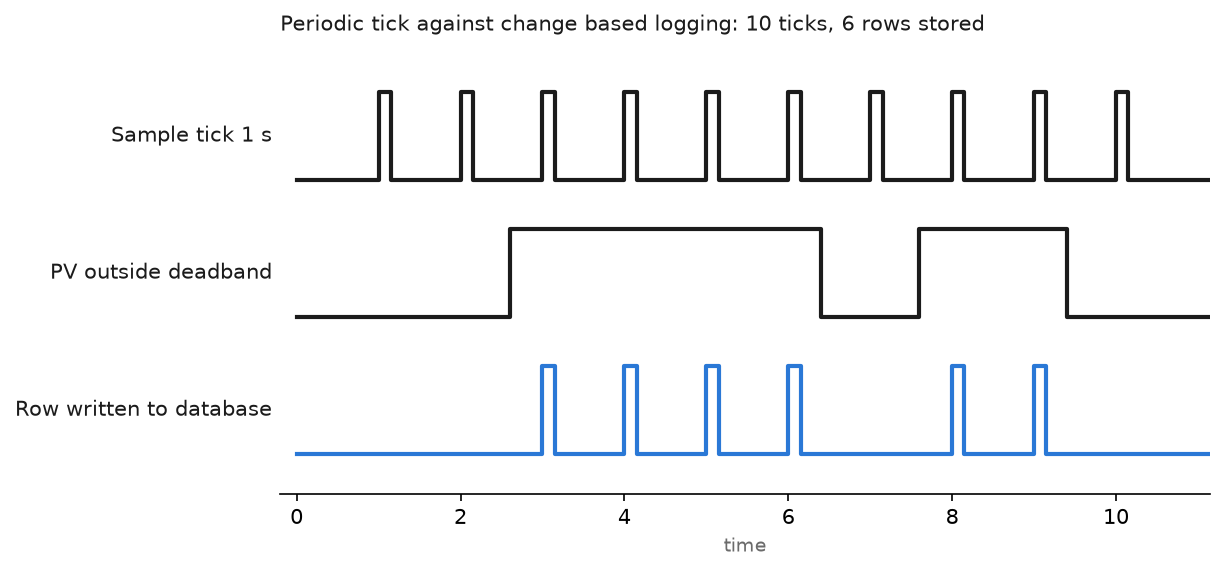
The chart shows ten sample ticks producing six stored rows, because the value only moved outside the deadband twice. Over a shift on a slow tank the ratio gets far better than six in ten.
Two rules to go with it. Always store a timestamp from one clock, preferably the controller, not from whatever PC happened to write the row. And always store the quality or a bad-data flag, because a row of zeros from a failed analog card looks exactly like a real zero two years later.
Log in the controller first
The network will go down, and the SQL server will be rebooted for patches on a Tuesday. If the data matters, buffer it in the controller so nothing is lost during the gap. A ring buffer of a few hundred samples costs almost nothing in a 1756-L83E.
(* Routine runs in a 1000 ms periodic task, so the task is the sample tick.
   Log_Buf is an array[0..599] of a UDT: Stamp DINT[7], PV REAL, Flow REAL. *)

(* deadband: only store when the value actually moved, or on a forced sample *)
IF ABS(Tank_PV - Log_Last_Stored) >= 0.5 OR Log_Force_Sample THEN

    GSV(WallClockTime, , DateTime, Log_Buf[Log_Head].Stamp[0]);
    Log_Buf[Log_Head].PV   := Tank_PV;
    Log_Buf[Log_Head].Flow := FT101_PV;
    Log_Last_Stored  := Tank_PV;
    Log_Force_Sample := 0;

    Log_Head := Log_Head + 1;
    IF Log_Head >= 600 THEN
        Log_Head    := 0;          (* wrap, the oldest sample is overwritten *)
        Log_Wrapped := 1;
    END_IF;
    IF Log_Count < 600 THEN
        Log_Count := Log_Count + 1;
    END_IF;
END_IF;

(* force a sample every 60 s even if nothing moved, so gaps are explainable *)
Heartbeat_Sec := Heartbeat_Sec + 1;
IF Heartbeat_Sec >= 60 THEN
    Heartbeat_Sec    := 0;
    Log_Force_Sample := 1;
END_IF;

(* runtime hours in the controller, the cheapest maintenance data there is *)
IF Motor_Running THEN
    Motor_Sec := Motor_Sec + 1;
    IF Motor_Sec >= 3600 THEN
        Motor_Sec   := 0;
        Motor_Hours := Motor_Hours + 1;
    END_IF;
END_IF;
Ten minutes of history sits in the controller at worst, far more once the deadband is doing its job. A collector reads Log_Head and Log_Count, pulls the rows it has not seen, and the outage becomes a backfill instead of a hole. Keep the buffer array in a controller scoped tag so any client can reach it, and keep Motor_Hours out of any first scan clear.
FactoryTalk View datalog, and its limits
Machine Edition on a PanelView Plus has Data Log models that write to internal storage, a USB stick or an SD card, in the terminal’s own file set, and feed the trend object. Tag count per model and file size are limited, so check the numbers for your version before you promise a customer 200 points. If someone wants a CSV they can open, the ME DataStore Plus ActiveX control does that job. Nobody backs up the terminal.
Site Edition Data Log models write either to a file set or straight into an ODBC database such as SQL Server. The file set is easier to set up and harder to query. If anyone will ever want a report, log to ODBC from the start.
Neither one is a historian. For long term process history, FactoryTalk Historian SE or an equivalent time series database compresses far better than a row per sample in SQL.
Getting Logix data out to CSV or a database
KEPServerEX or FactoryTalk Linx Gateway. Build an EtherNet/IP channel to the controller, add the tags, and let a client read them over OPC UA. KEPServerEX has a DataLogger plug-in that writes straight to ODBC on a schedule or on a trigger tag, and an IoT Gateway plug-in for MQTT. Channel and device setup is in Kepware channel configuration, with the background in what is Kepware OPC and OPC for PLC integration.
Ignition. The Tag Historian module handles deadbands, store and forward buffering, and partitioned tables without you writing SQL. Transaction Groups in the SQL Bridge module handle the row-per-event case, which is what you want for OEE and batch records.
Node-RED. Cheap, quick, and useful on a small line. An EtherNet/IP node reads the controller, a function node formats the row, and a file node appends a CSV. Use it for a two week investigation, not for a quality record.
For a one-off pull to a spreadsheet, the simple route is in how to get data from PLC to Excel.
SQL logging with FactoryTalk Transaction Manager
Transaction Manager, the product that used to be RSSql, sits between the control system and a database and moves rows in both directions. The parts you configure are the same every time:
- A control connector, normally FactoryTalk Live Data or RSLinx Classic OPC, pointing at the controller. One connector of each type per host PC.
- An enterprise database connector, ODBC or OLE DB, with the DSN, database name and credentials.
- Data points, the controller tags the transaction is allowed to read and write.
- A transaction, scheduled on a timer or unscheduled and fired by a trigger tag, mapping data points to table columns or stored procedure parameters.
Two habits pay off. Trigger on a handshake bit that the controller sets and Transaction Manager clears, so the PLC knows the row was written and can hold the next one. And keep the trigger rate well under one transaction per second per connector; this is not a high speed collector, and stacking transactions is how you get duplicated and missing rows.
Remote monitoring without leaving a hole
The dangerous shortcut is port forwarding EtherNet/IP straight from the internet to the PLC. Port 44818 open to the world is scanned within hours, and the protocol has no authentication worth the name.
What to do instead:
- Outbound only. Let an edge gateway or the historian open the connection out to a broker or a cloud endpoint. Nothing inbound to the control network.
- MQTT over TLS with client certificates, not a username and password in a config file. Sparkplug B if the consumer supports it, because it carries birth and death messages so you can tell a dead link from a steady value.
- Read only credentials. An OPC UA user that cannot write is a five minute job and removes an entire class of accident.
- Zones and conduits. Control network on its own VLAN, one firewalled path in and out, as set out in IEC 62443. The office network is not a zone boundary.
- VPN with named accounts for engineering access, disabled when the contractor leaves, and a log of who connected and what they wrote. Shared VPN credentials always outlive the project.
The full remote access picture is in remote monitoring and control of PLC systems, and the hardening steps in implementing cybersecurity measures for PLC systems.
Field notes: what actually goes wrong
The 80 GB table nobody could query. A packaging site logged 380 tags at 250 ms into one flat SQL table with no partitioning and a single index on the timestamp. Twelve weeks later a downtime report took six minutes to run and the plant stopped using it. The fix was a deadband on every analog tag, a move to monthly partitions, and dropping 140 tags that nobody had ever queried. The table shrank by more than nine tenths and lost nothing anyone missed.
Three clocks, three stories. Controller timestamps, HMI PC timestamps and SQL server timestamps were all in use on one line, and two of the three machines had drifted by more than a minute. A fault investigation produced an event order that was physically impossible. NTP on everything, and one clock chosen as the source of truth for stored rows.
Frequently asked questions
How fast should I sample?
Fast enough to see the shortest event you care about, which usually means at least twice per event. For a 40 ms interlock pulse, log it in the controller as a latched count instead of trying to sample it.
Can a ControlLogix write to SQL by itself?
No. It needs a middleman: Transaction Manager, Kepware, Ignition or a custom service. The controller prepares the row and sets a handshake bit.
Is MQTT safe on a control network?
It is safe when the connection is outbound, encrypted with TLS, authenticated with client certificates, and the broker sits outside the control zone. The protocol itself is not the risk, the firewall rule is.
Do I need a historian, or is SQL enough?
SQL is enough up to a few hundred tags with deadbands. Past that, a time series database compresses better and answers range queries far faster.
Next step
Pick one line and one question, such as which stop reason costs the most minutes per week. Log only the tags that answer it, with a deadband and a controller timestamp, keep the ring buffer as insurance, and only then connect a dashboard. The trend tooling that fills the gap while you build the history is in PLC trend chart settings and monitoring, and the wider plant data path in using IIoT with PLC systems.