
PLC Trend Page Usage, Tag History and Monitoring
PLC Programming Trend Chart
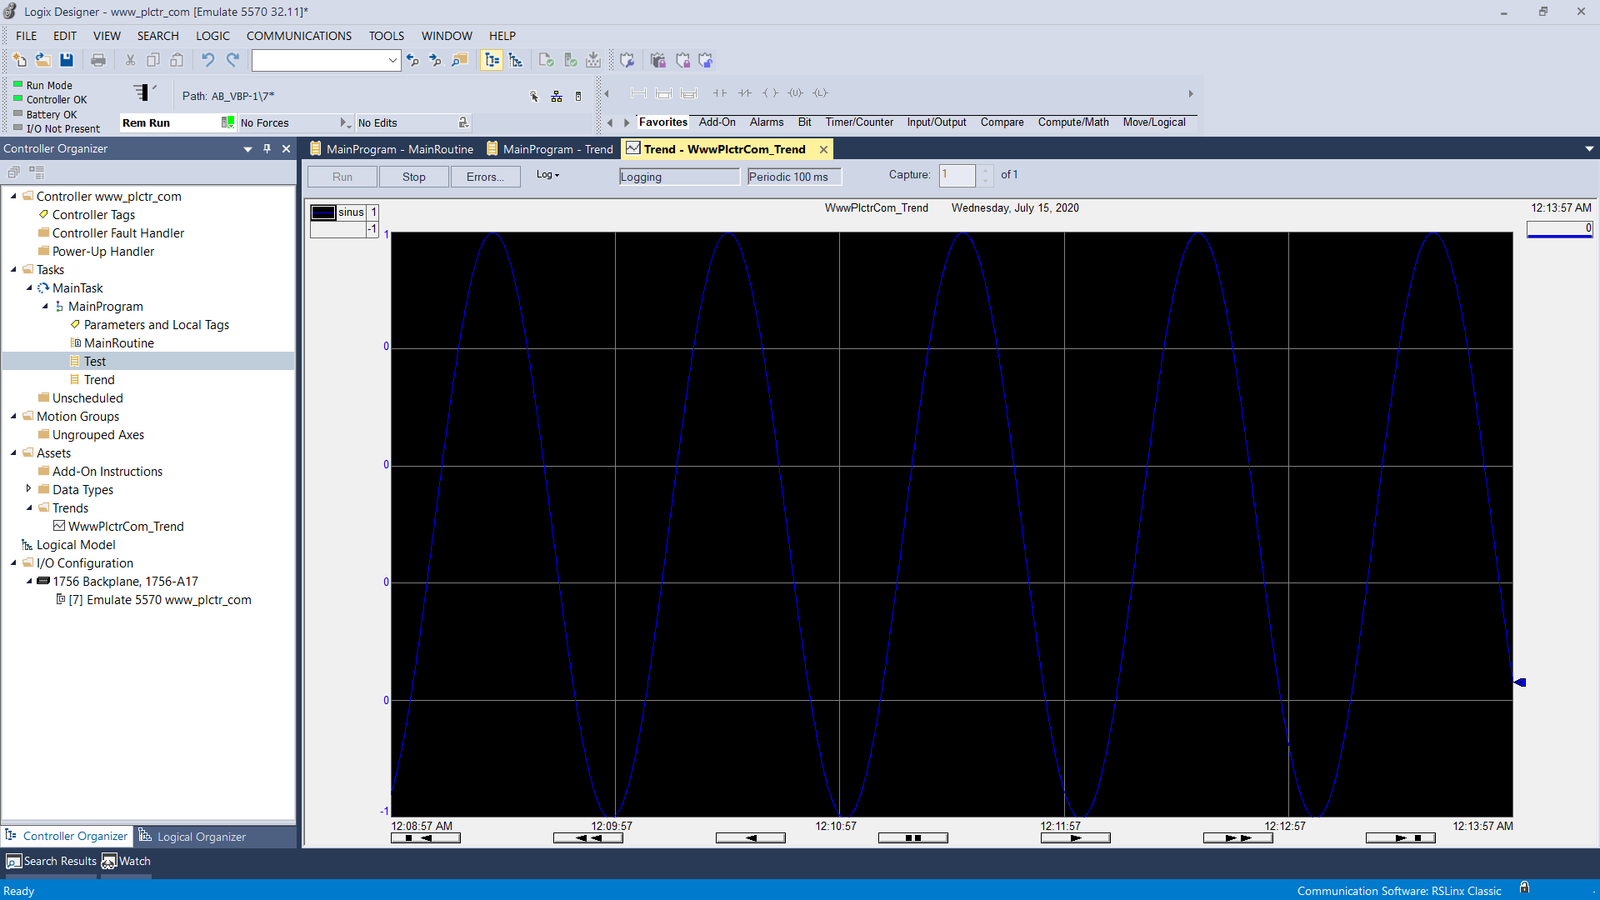
PLC Trend pages are used to follow the values online in the form of graphics when we determine the values.
Where and how to use PLC Trends, what are the benefits, we will explain the tricks and trend settings in this article.
You do not need to constantly monitor variable or tag values from plc
It can generally be used for reports and fault solutions.
It is widely used for analog values, but it can be used in PLC (programmable logic controller) to follow digital inputs and especially to find faults.
The trend chart is very important for the maintenance team and technical staff.
In the trend chart, you can watch all tags that exist in plc.
As an example of watching analog tags,
In the plc pressure or temperature control system, when you add the input and output values to the analog output values in the trend to see how the pressure and temperature values work according to the PID block you set, the comments such as what was the output, and what temperature value you have obtained accordingly, you can easily interpret it by looking at it and you don’t have to follow the most important feature every second.
Likewise, you can follow driver speed information, current information, encoder information.
Since PLC reaction times are very fast, you can miss instant values. When you select the sampling rate from the trend chart, you can catch the changes that you cannot see with the eye in the trend chart and take your precautions accordingly.
Especially in fault solutions, the trend chart plays a very important role.
Of course, besides the trend graph, you can find the fault solution by installing logic circuits in PLC, but this requires more effort and effort.
To keep history, you must create a series and so on.
Since the trend is easy and fast to use, I recommend the trend chart as a fault tracking method.
How to create a PLC Trend chart, how to make settings, what are the important and tricks, you can find in our next article.