The output that never came on is the only fact you have, so start there: right-click Conv3_Run, press Ctrl+E, and read the Destructive column of the cross reference before you read a single rung. On a 1756-L83E running Logix Designer v33 that list names every routine and instruction that touches the tag, and one destructive entry means one owner and the answer is on that rung, two in different routines means the bug is already found, and zero means nothing in the program drives it at all. Work backwards from there and the logic tells you where it stops. Below is that order of work, the Studio 5000 tools that make it quick, and the four logic errors behind most of the calls.
The method works the same on a CompactLogix 5380 and back to v21.
Before you open a routine
| Check | Why it comes first |
|---|---|
| Controller Properties → Major Faults | A faulted controller is not running your rungs at all |
| The forces indicator on the online bar | A forced bit makes every rung on the screen lie to you |
| I/O Configuration for yellow triangles | A failed connection freezes an input at its last value |
| The key switch | REM against PROG looks identical to dead logic from the operator side |
| Your project matches the controller | Studio 5000 tells you when you go online |
Fault codes and what they mean are in ControlLogix major faults and fault codes, and connection level causes in Allen-Bradley PLC I/O faults.
Step 1: Name the output, then find every rung that writes it
Go online. Find the tag that should be on and is not, say Conv3_Run.
Right-click the tag and choose Cross Reference, or press Ctrl+E. The list shows every routine, rung and instruction that touches it, with a Destructive column marking the ones that write it. Read that column first.
One destructive reference means one owner and the answer is on that rung. Two OTEs on the same tag in different routines means you have found the bug already, and the rest of this article is optional. Zero destructive references means nothing drives that tag and somebody expects the HMI to write it.
Search is the other half. Search → Find with Find All, scope set to all routines, gives a Search Results list you can click through. Leave the scope on the open routine and you will conclude a tag is used in one place when it is used in six.
Step 2: Read the highlighting for what it is
A rung online shows a green highlight along the true path. That is the condition at the moment Studio 5000 last read the controller, not every scan. Three things to keep straight:
- A highlighted contact means the bit was true in that sample.
- A highlighted OTE means the rung condition into it was true in that sample. The output tag can still be off if another rung writes it later in the scan.
- A routine where nothing ever changes on screen, while the machine is clearly doing things, is usually not being scanned at all.
A routine behind a JSR that is only called in one state looks normal on screen and never runs. Check who calls it.
For fast bits the highlighting is useless, for the same reason the Watch window is: it is a sample. Latch the event in logic or put it on a trend instead. The sampling limit is worked through in how to use the Studio 5000 Watch window.
Step 3: Walk backwards, one condition at a time
On the rung that owns the output, read the series conditions from right to left. For each one that is not highlighted, ask what writes it, and cross reference that tag. Repeat. You are following a chain, and the chain always ends at one of four places:
- A physical input that is not what the field says it is.
- A tag written by another routine that is not running.
- A tag written by the HMI or by a MSG that is not arriving.
- A latch that was set months ago and nothing ever unlatched.
Write down each tag as you go. The list is the note you leave for the next shift.
The worked example: a motor that starts and stops instantly
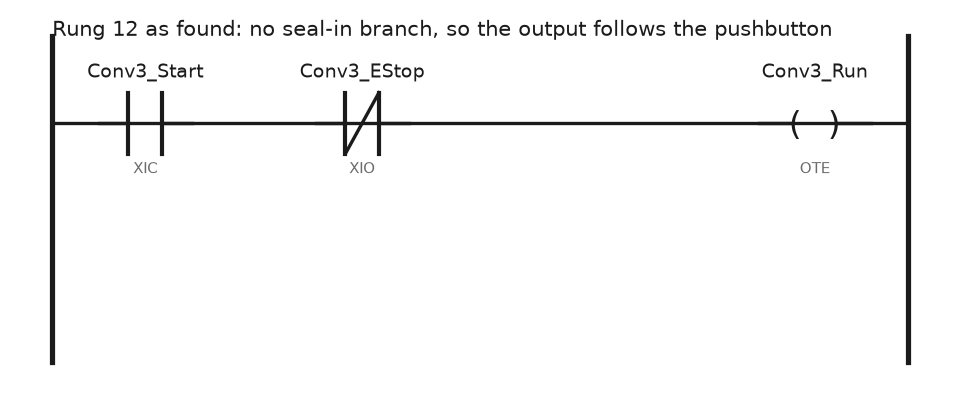
Rung 12, Conveyor3 routine, as found

  |--] [--------]/[------------------( )--|
     Conv3_Start   Conv3_EStop        Conv3_Run
       XIC           XIO                OTE
The operator pressed Start, the conveyor ran for as long as the button was held, and stopped when they let go. The logic is correct and the machine is wrong, which is the definition of a missing seal-in.
Rung 12, fixed

  |--] [--------]/[------------------( )--|
     Conv3_Start   Conv3_EStop        Conv3_Run
       XIC           XIO                OTE
  |--] [--|
     Conv3_Run
       XIC
The parallel branch around the start contact keeps the rung true after the button opens. It is the oldest rung in the trade and it still gets left out, usually by someone copying an example written for a maintained selector switch. The four bit combinations behind it are in PLC bit instructions XIO and XIC.
A detail that matters on this rung: Conv3_EStop must be wired normally closed and read with an XIO, so a broken wire stops the conveyor. If somebody wires it normally open and flips the instruction to XIC to make the logic look right, the machine runs fine and fails to stop when the wire breaks.
The four logic errors behind most calls
| Error | What you see | How to find it |
|---|---|---|
| Two OTEs on the same tag | Output flickers, or only one condition ever works | Cross Reference, Destructive column, two entries |
| Missing seal-in | Output follows the pushbutton instead of latching | The rung above. No parallel branch on the start contact |
| OTL with no matching OTU | Output stays on after the condition clears, survives a power cycle | Cross Reference shows an OTL and no OTU anywhere |
| Wrong tag scope | Logic writes Step in one program while the HMI reads Step in another | Two tags with the same name, one controller scoped and one program scoped |
The double coil is the worst of them because it is invisible in one routine. With two OTEs on Conv3_Run in different routines, the one that scans last wins every time, and the other rung highlights green while the output stays off. Nothing on the screen is wrong. The cross reference is the only place the truth shows.
Scope collisions come from copying a program and forgetting that program scoped tags copy with it. Sort the tag editor by scope once and the duplicates stand out.
Step 4: Pull the controller’s own record with a GSV
When the fault is intermittent, the controller already knows more than you do. GSV reads system objects, and three of them earn their place in every project.
(* Runs in a 1 second periodic task. Gives you a history you can read later. *)

(* 1. Last major fault raised by this program, 44 bytes, mapped onto a UDT *)
GSV(Program, THIS, MajorFaultRecord, Flt_Now);

(* 2. Scan time of MainTask, in microseconds *)
GSV(TASK, MainTask, LastScanTime, Task_Scan_us);
GSV(TASK, MainTask, MaxScanTime,  Task_Max_us);

(* 3. Controller clock, so your latched faults carry a timestamp *)
GSV(WallClockTime, , DateTime, Now_DT[0]);

IF Task_Scan_us > Task_Scan_Worst THEN
    Task_Scan_Worst := Task_Scan_us;
    COP(Now_DT[0], Worst_Scan_Stamp[0], 7);
END_IF;

(* latch the first I/O fault of the shift, with its time *)
IF Conv3_Module_Fault AND NOT IO_Fault_Latch THEN
    IO_Fault_Latch := 1;
    COP(Now_DT[0], IO_Fault_Stamp[0], 7);
END_IF;
MajorFaultRecord maps onto a UDT of two DINT timestamps, Type and Code as two INTs, then eight DINTs of fault specific information. The record belongs to the program, so read it from the program that owns the logic or from its fault routine. Type 4 faults are your logic: code 20 is an array subscript out of range or a bad .POS or .LEN in a control structure, code 31 is a JSR whose parameters do not match its SBR, and code 16 is an instruction the firmware does not know. The routine that holds this and what it may safely clear are covered in create a controller fault routine.
Watching MaxScanTime is worth the two lines on its own: a conveyor that faults once a week after a contractor visit usually has a scan time that crept.
Step 5: Compare against the file that used to work
When the machine ran yesterday and does not today, stop reading rungs and diff the project.
Rockwell ships the Logix Designer Compare Tool, installed alongside Studio 5000 and launched from the Windows start menu rather than from inside Logix Designer. Point it at two ACD or L5X files and it reports every difference: rungs, tag values, task configuration, module properties.
Upload the project from the controller into a new file, compare it against the copy on the server, and read the differences. Most of “it just started doing this” turns into a rung somebody edited online and never documented. Keeping that copy current is the whole point of best practices for PLC program documentation.
Field notes: what actually goes wrong
The online edit that was never assembled. A rung sat in test mode for six weeks. The machine ran the test edit, the ACD on the server had the original, and every comparison people ran looked at the wrong copy. The giveaway is the edit zone marker on the left of the rung and the pending edits indicator on the online bar. Assemble or cancel before you go home.
The force that outlived the commissioning. A level switch was forced on during a startup test in March. In August the tank actually ran dry and the pump ran on. Two entries in the force list, both from startup. Open Controller Tags in Monitor view with the Force Mask column showing on every visit, not only when something is broken.
The array index that grew. A bagger faulted at random with a type 4 code 20. A production counter indexed a Recipe[20] array and ran past 19 at the end of a long batch. It only appeared on the longest runs, which is why nobody could reproduce it on a Monday morning.
Frequently asked questions
How do I find where a tag is written in ControlLogix?
Right-click the tag and choose Cross Reference. Read the Destructive column, which marks the instructions that write the tag instead of reading it.
Why is my rung green but the output off?
Something else writes that output later in the scan. Cross reference the tag and look for a second destructive reference, or for an OTU that clears it.
Can two OTEs use the same tag in Logix?
Studio 5000 does not stop you. The last one to scan sets the final state. Treat it as a bug, not a technique.
What does a type 4 major fault mean?
It is a program fault. Common codes are 20 for an array subscript out of range, 31 for a JSR parameter mismatch, and 16 for an instruction the firmware does not recognise.
Next step
Put the capture in place before the next intermittent fault. Add the GSV block above to a 1 second periodic task, latch the first fault of the shift with a timestamp, and build a named watch list with the sequence step and the interlocks on it. The wider order of checks, from LEDs to the network, is in advanced PLC troubleshooting techniques.