Flashing green on every module OK light, with the controller OK light still solid green, is the rack saying it lost its connections rather than its cards. That read takes two seconds from the doorway and it sends you to the switch and a 16#0203 connection timeout instead of to the spares cabinet. The order below runs from the LEDs to the Major Faults tab, then the connection codes, the force list, and the Ethernet checks that catch the faults nobody logs. Examples use Studio 5000 v33 with a 1756-L83E, and the Siemens equivalents on an S7-1500.
Work the order top to bottom. Skipping ahead to the logic is how an afternoon disappears.
What you need in the bag
| Item | Why |
|---|---|
| Laptop with the matching Studio 5000 version | A v31 project will not open in v24. Carry the versions your site runs |
| RSLinx Classic or FactoryTalk Linx | Browsing the network tells you what is alive before you go online |
| Ethernet cable and a spare managed switch port | Mirror port if you plan to capture traffic |
| Multimeter | Half of the “PLC problems” I get called for are a 24 V supply sagging under load |
| TIA Portal | For the Siemens racks on the same line |
| The current ACD or AP17 file | Uploading from a controller that is faulted is not always possible |
Step 1: pin down the symptom before you touch anything
Three questions for the operator, before the laptop comes out.
- What was the machine doing when it stopped? Running steady, changing product, starting after a break.
- Does it repeat? Every cycle, once a shift, only on nights.
- What changed? A module swap, a download, a cleaning crew with a pressure washer.
“It just stopped” is not a symptom. “It faults on the third bag after a product change, only on line 2” tells you where to put the trend. Write it down, because you will read it again in an hour when everything looks fine.
Step 2: read the LEDs from the doorway
Status lights answer in two seconds what the laptop takes five minutes to tell you.
| LED | State | What it means |
|---|---|---|
| Controller OK | Solid green | Running, no major fault |
| Controller OK | Flashing red | Major fault present, or the controller is in a recoverable fault state |
| Controller OK | Solid red | Unrecoverable. Usually needs firmware reflash or replacement |
| Module OK on an I/O card | Flashing green | Module is present but the connection to the owner is not open |
| Module OK on an I/O card | Flashing red | Connection faulted or the module has its own diagnostic fault |
| NET status on an Ethernet module | Flashing green | Device online, no CIP connections established |
| NET status on an Ethernet module | Solid red | Duplicate IP address detected |
| FORCE | Solid or flashing amber | Forces are installed. Read this before you believe anything you see online |
A rack of flashing green module lights with a healthy controller means the controller lost its connections, not that the cards failed. That distinction sends you to the network instead of the spares cabinet.
Step 3: read the controller fault, not the HMI message
Go online and open Controller Properties → Major Faults. Studio 5000 shows the type and code plus a text description. The pairs you will meet most often:
| Type | Code | Meaning |
|---|---|---|
| 1 | 1 | Power loss |
| 3 | 16 | I/O connection failure, module not responding |
| 3 | 23 | Connection to a module failed while running |
| 4 | 16 | Array subscript out of range |
| 4 | 20 | Control structure LEN or POS invalid |
| 4 | 31 | JSR parameter mismatch |
| 6 | 1 | Task watchdog expired |
Type 4 faults are your logic. An array index driven by a production counter that rolled past the array size is the classic. Type 6 means a task did not finish inside its watchdog, which on a machine that ran for a year usually means a new loop or a MSG that stopped completing.
To capture the record instead of reading it off a screen, put a GSV in the controller fault handler. MajorFaultRecord is a 44-byte block: two DINT timestamps, then Type and Code packed as two INTs inside one more DINT, then eight DINTs of fault-specific info. Read it into a UDT shaped the same way and you get named members instead of unpacking words by hand.
(* UDT: FaultRec_Type
     TimeLow  DINT
     TimeHigh DINT
     Type     INT
     Code     INT
     Info     DINT[8]
*)

(* Controller Fault Handler, ST. Runs once when a major fault occurs. *)

GSV(Program, THIS, MajorFaultRecord, Flt_Now);

(* keep the last four so an intermittent fault leaves a trail *)
COP(Flt_History[0], Flt_History[1], 3);
Flt_History[0] := Flt_Now;

(* clear the fault only where the process allows it *)
IF Flt_Now.Type = 4 AND Flt_Now.Code = 16 AND Allow_Auto_Clear THEN
    Flt_Now.Type := 0;
    Flt_Now.Code := 0;
    SSV(Program, THIS, MajorFaultRecord, Flt_Now);
END_IF;
Clearing a type 4 fault automatically is a decision, not a default. On a bagger with a bad array index it buys a shift. On anything that moves mass, let it stop. The routine itself is created the way described in create a controller fault routine, and the code list is in ControlLogix major faults and fault codes.
Step 4: check the I/O connections one module at a time
If the controller is clean, the fault is usually a connection. Under I/O Configuration, a module with a yellow triangle has a problem the controller knows about. Open its properties and read the Connection tab; the fault text at the bottom names the condition and gives a hex code.
| Code | Cause | First thing to check |
|---|---|---|
| 16#0203 | Connection timed out | Cable, switch port, device power |
| 16#0204 | No response to the connection request | Wrong IP, device off, path through a gateway |
| 16#0116 | Electronic keying revision mismatch | Firmware on a replacement module |
| 16#0117 | Wrong module in the slot | Someone swapped an IB16 for an IB16D |
For remote racks, the adapter’s input tag carries per-slot status. Rack3:I.SlotStatusBits with a bit set means that slot is not communicating even though the rack itself is online. Latch the first one that drops, because by the time you get to the panel the rack has usually recovered.
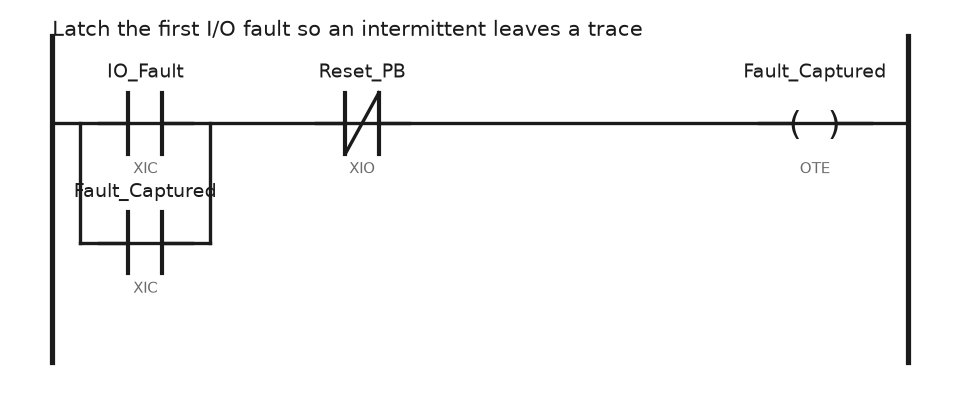
The rung is trivial and it has saved me more hours than any diagnostic tool. XIC on the module fault bit, sealed in through its own output, XIO on a reset pushbutton. An intermittent that clears in 200 ms leaves a latched bit and a timestamp instead of a rumour. Deeper per-module causes are listed in Allen-Bradley PLC I/O faults, causes and solutions.
Step 5: look for forces and unfinished edits
Three conditions make the logic lie to you, and all three show in the controller status bar if you know where to look.
Forces. The FORCE indicator on the toolbar shows installed and enabled forces. Open Logic → Monitor Forces and read the list. A forced input reads as its forced value everywhere, including on the HMI, so the rung looks right while the field device says otherwise.
Pending or test edits. A rung in test mode runs, but the original rung is still in the project until someone assembles the edits. Go offline, upload, and compare against the file on the server.
Key switch position. REM and PROG look identical to a comms failure from the operator’s side: outputs off, nothing responds.
Step 6: narrow it down with cross-reference and a trend
For a bit that is in the wrong state, right-click the tag and choose Cross Reference. You get every routine that reads or writes it. Two OTEs writing the same tag in different routines is a real bug and the cross-reference finds it in five seconds.
For anything intermittent, build a trend with the analog value, the command bit and the fault bit, set the sample period as fast as the tool allows, and leave it running. Come back after the next occurrence and read the order of events. Setup is in PLC trend chart settings and monitoring.
Ethernet checks when the fault is on the wire
ping 192.168.1.24 -tfrom the same subnet. A timeout between good replies is a marginal link, not a dead one.arp -aafter the ping. One IP whose MAC keeps changing means a duplicate address.- Browse in RSLinx. A device that appears and disappears on refresh is flapping.
- Open the Ethernet module’s web page. Its Diagnostics section reports CIP connection counts and media counters; rising CRC errors on one port point at a cable, not the controller.
- Read the switch port statistics for errors and duplex mismatch. Fixed 100/full on one end and auto on the other gives late collisions and a network that works until it is busy.
On the Siemens side, the diagnostic buffer does most of this for you: go online, open Online & diagnostics → Diagnostics buffer, and read from the top. Entries are timestamped and ordered, so a station failure followed by an OB86 entry tells you which device dropped and when, and the buffer survives a power cycle.
Field notes: what actually goes wrong
The force nobody removed. A filler ran for three months with a level switch forced on after a commissioning test. It only became a problem when the tank actually ran dry and the pump ran on. The force list was two entries long and had been there since startup. Check the force list on every visit, not only when something is broken.
Analog input pinned at 32767. A dryer temperature read full scale after a shutdown. The card was fine. A field wire had been cut by a cleaning crew, and the 4 to 20 mA card reported open circuit as over-range. The trend showed the value step to full scale in one sample, which is a wire, not a process. A process temperature never changes 400 degrees in 100 ms.
Watchdog fault after an innocent change. A contractor added a MSG to read a weigh scale from a continuous task with no completion gating. Scan time crept from 12 ms to 60 ms over a week as the scale got slower to answer, then the periodic task overran its watchdog and the controller went to a type 6 fault. Fixed by moving the MSG to a 500 ms periodic task and gating it on .EN. Keep best practices for PLC program documentation in place so a change like that is visible in review before it ships.
Frequently asked questions
Where do I start when the controller is in a major fault?
Controller Properties, Major Faults tab. Read type and code and write them down before you clear, unless a fault handler already captured the record.
What is the difference between a major and a minor fault?
A major fault stops the controller unless a fault handler clears it. A minor fault sets a bit and keeps running, which is why a low battery or a math overflow can sit unnoticed for months. Poll the minor fault bits and alarm on them.
How do I troubleshoot a network I cannot ping?
Get on the same subnet first, with a static address in range. If the device still does not answer, check the switch link light and port statistics. No link means a cable or a port, not a configuration problem.
Can I do this on DeviceNet or Profibus?
The method is the same, the tools differ: node status LEDs, scanner error codes, then the trunk. Codes and causes are in DeviceNet troubleshooting and Profibus faults and network problems.
The machine faults once a week and nobody sees it. Now what?
Latch the first fault, timestamp it with a GSV of the wall clock, and run a background trend until the next occurrence gives you data.
Next step
Build the capture before you need it. Add a fault handler as described in PLC controller fault routine, then put the latched fault bits and timestamps on an HMI screen so the operator can tell you what happened without a laptop.