When the Data Layer Is the Wrong Answer: What Not to Connect
Open OPC UA Access on a GuardLogix safety tag and the list has two entries in it: Read Only and None. Rockwell took Read/write off the menu in firmware, and publication 1756-UM023B-EN-P adds that with the controller online you cannot edit that setting at all, cannot delete a safety tag that is published, and cannot rename one.
A controller vendor decided that in the firmware. Most of what follows is the same decision made, or not made, in a design review.
So: four things that should not go on a data layer, and what to do instead of each. A safety function has no business there at all. A control loop that closes across a network is a control loop with a failure mode it did not have before. A tag published at 10 ms because the box accepted the number costs the controller something and nobody ever reads the result. And an MES that can write a setpoint is an MES that can stop production from a building away, at three in the morning, from a script somebody ran by mistake.
None of these is done out of carelessness. Every one has a reason behind it that sounds fine in the meeting.
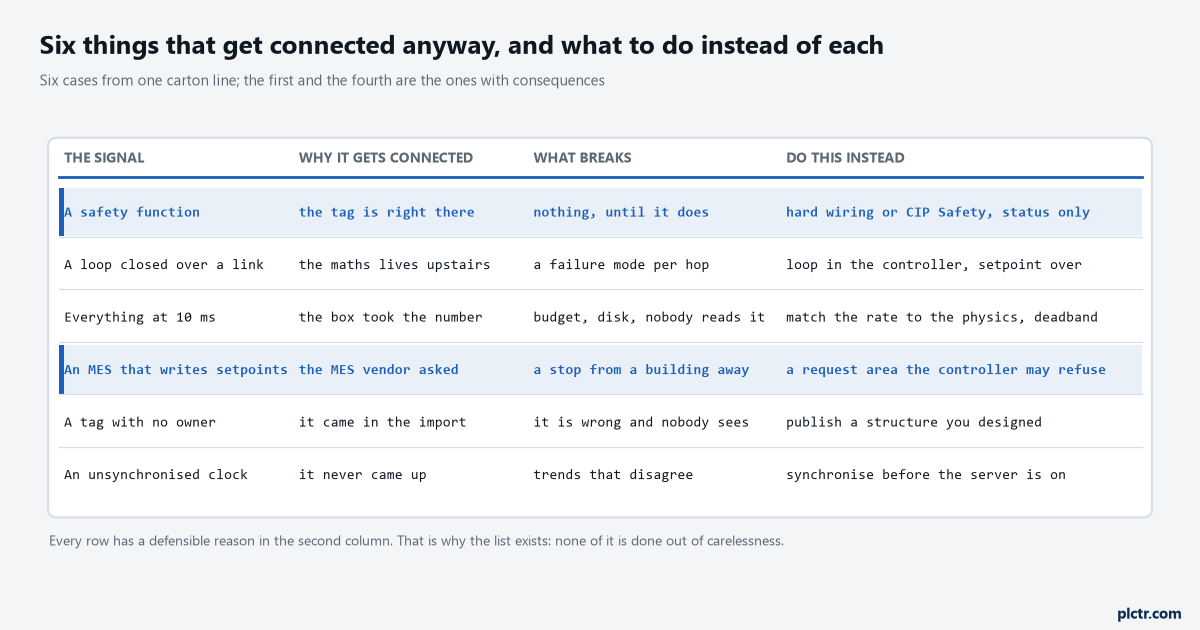
The second column is the point of this table. Every one of these has a reason that survives being said out loud, which is why the list is worth writing down rather than assuming.
A safety function, and the one thing you may publish from it
Transfer TR-14 has a guard door, a 440R-S12R2 relay with a monitored reset, and a safety contactor K30 that removes the coil supply from both starters.
That circuit works with the 1756-L83E in Program mode. It works with the PanelView switched off, and it works with the processor sitting in a major fault, and those three facts are the entire reason it is built the way it is rather than as four rungs. A data layer has none of those properties. The OPC UA server in the controller is disabled by default and needs a message instruction to turn on; it shares its resources with CIP Class 3 communication and runs at lower priority than it; the manual says in as many words that during periods of high Class 3 demand the reduction in available CPU time can lead to the rejection of OPC UA traffic. Every one of those sentences is fine for a dashboard and disqualifying for a safety function. The relevant standards — IEC 61508 and IEC 61511 for the process side, EN ISO 13849 for machinery — all ask you to account for the integrity of everything in the path, and there is no version of that accounting in which “a subscription that may enter a state called LATE” appears as a link.
What you may do is read. K30_Mirror is a mechanically linked auxiliary contact wired to an ordinary 1756-IB16 point, it tells the program that the coil supply is present, and publishing it Read Only tells a dashboard the guard is shut without putting anything on the data layer that could ever open it. That distinction is the whole article in one bit: the data layer observes the safety circuit and is never inside it. Moving the same safety function from a 440R relay to GuardLogix walks the boundary from the other side, and where a safety signal genuinely has to travel between controllers, CIP Safety produced and consumed tags is the mechanism that exists for it — a protocol that had to be built precisely because ordinary EtherNet/IP was not enough on its own.
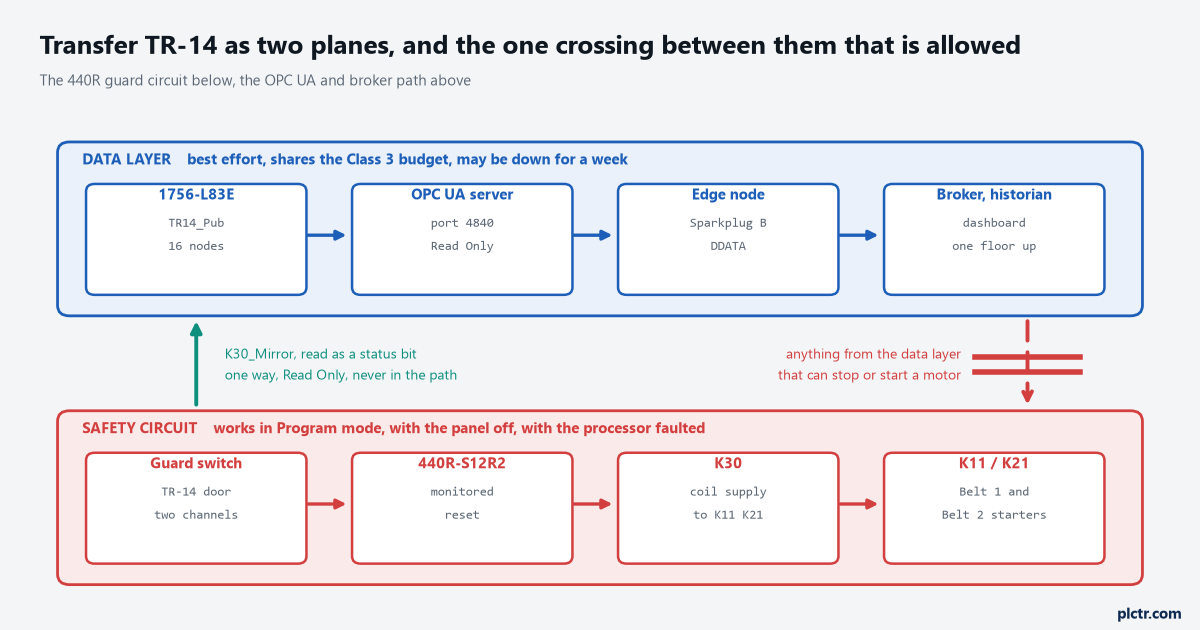
One arrow up, none down. The green crossing is a status bit going where it can be looked at; the barred one is anything from the data layer that could stop or start a motor.
A control loop that closes across a network
Somebody has a model upstairs, it is a good model, and closing the loop with it seems like one afternoon of integration.
Work the timing honestly and it stops looking like one afternoon. In the controller the correction happens inside a 30 ms periodic task and the number is deterministic because the task period is the guarantee. Across the data layer, the same correction waits to be sampled — and Part 4 of the OPC UA specification is careful about what a sampling interval means, calling it a best effort cyclic rate, saying the server may sample faster than it, saying only that the time between values returned to the client will be at least the interval, and adding that the server’s sampling and the update cycle of the underlying system are usually not synchronised, so changes get detected later than either number suggests. Then it waits for the next publishing cycle, which on a normal plant subscription is a second. Then the model decides. Then a write comes back down, lands in a tag, and is read by the next execution of the task. Measured end to end on a quiet network with nothing at all wrong, that is 2.35 seconds against 30 milliseconds, and the 2.35 is not a worst case — it is the number you get on a good day. The worst case is the one the specification names: a subscription enters LATE when the publishing timer expires with notifications ready and no publish request queued to carry them, and if the client stays away long enough the lifetime counter terminates the subscription entirely. Now your loop is open and the only thing that knows is a status code nobody put on a screen.
Two point three five seconds against thirty milliseconds. On a good day.
Do it the other way round and everything gets simpler. The loop lives in the controller where the scan is the guarantee, and what comes down the data layer is a setpoint, at whatever rate the process actually changes, through a handshake that says whether it was accepted. If the link dies the loop keeps running on the last accepted setpoint and the machine does not notice. The scan time article has the method for measuring what the controller side costs, which is usually about a tenth of what people assume.
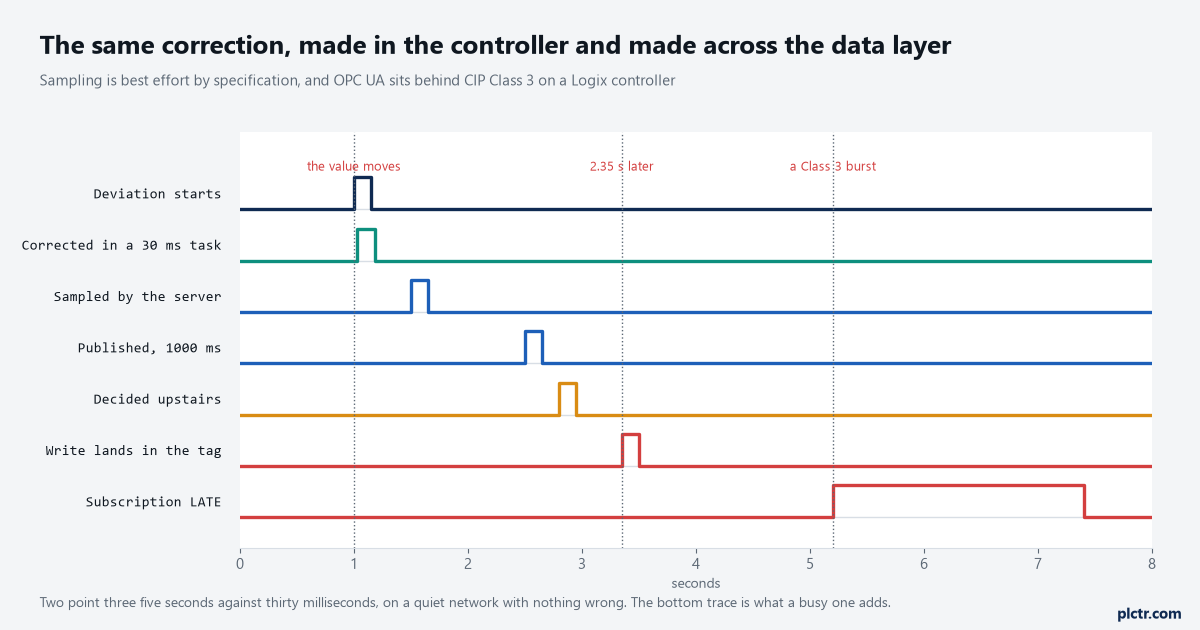
Every gap on this chart is normal behaviour, correctly configured. The bottom trace is what a busy controller adds on top, and it is the one that has no number you can put in a specification.
Ten milliseconds, because the box accepted the number
Fifteen members of one small machine, published every 10 ms, is 1500 values a second and 129,600,000 a day.
At twelve bytes a value that is 1.56 GB a day of raw traffic before anything indexes it, and the question worth asking is what it bought. Over a whole shift the run command on Belt 1 changed 82 times. Every state bit on TR-14 put together changed 742 times in eight hours, which is 2226 in a day across three shifts. So the 10 ms subscription generated roughly 43,000 samples for every state change it carried, and the changes are still there, buried, in a table nobody queries twice. Meanwhile the ceilings are real and shared: the OPC UA server in a 1756-L83E serves 1200 nodes, allows 20 subscriptions and 5000 monitored items in total, and takes at most 10 external clients, so a fast subscription for one machine is spending a budget that the historian, the dashboard, the MES adapter and the next engineer’s laptop all draw on. And the specification has a quiet consequence for anybody who thinks a queue fixes this: when a monitored item’s queue is full and the queue is longer than one, the discarded notification sets an Overflow bit in the InfoBits of the status code, which means the data has a flag on it saying it is incomplete, which means somebody has to read the flag.
The rate is set by the physics, not by the field.
A carton passes the end-of-line eye in about 600 ms, so 100 ms samples it five times over and 500 ms still catches it. A contactor closes in 10 to 30 ms, so if what you want is the mirror contact’s transition then publish on change rather than on a cycle, and the transition arrives with its own timestamp anyway. Report by exception with a deadband on the analogue points is what most plants end up with, it is about 52,600 rows a day for this machine, and it holds every change that happened. Sizing tag history from the sample rate and the deadband is the arithmetic for the storage end of that decision.
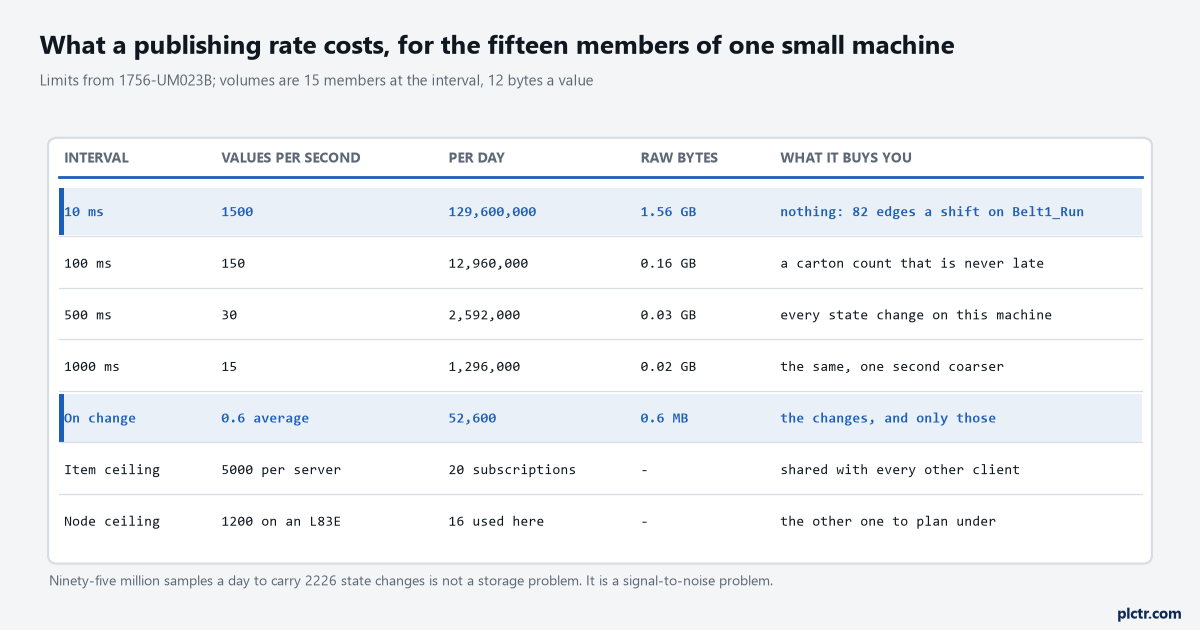
The gap between the first row and the fifth is four orders of magnitude of traffic carrying identical information. The last two rows are the ceilings that every other client on the controller shares with you.
An MES that can write a setpoint
The default is on your side here, and the temptation is to change it on the first afternoon.
OPC UA Access starts at None for controller and program scoped tags, which means a freshly built project publishes nothing until somebody decides to. Leave it there for everything, then open exactly two tags: a request value and a request identifier. The MES writes both and nothing else. The controller reads them, checks them against limits that live in the controller rather than in the MES — on TR-14 the belt setpoint is accepted between 0.20 and 0.45 m/s, refused while the belt is running, refused while Belt1_Blocked is true — and either copies the request into the owned tag or writes a refusal code back. Six reasons, one SINT, and the operator at the panel gets told which rule the request broke. The test that this is built correctly is one question: can the person standing at the machine override what the MES sent? If the answer is no, you have given a remote system authority over a machine that somebody is standing next to, and the fact that it works today is not the same as it being right. Writing a setpoint back into a PLC through a handshake works this through end to end, and the access question sits inside the wider one that hardening a Logix cell covers.
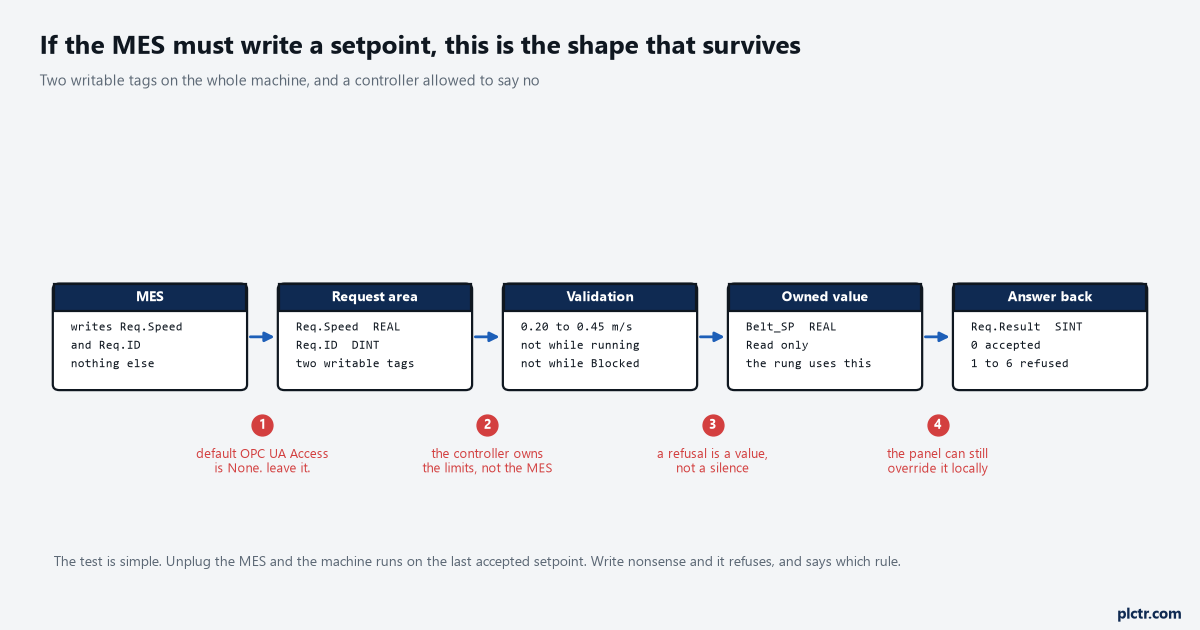
Two writable tags on the whole machine. Unplug the MES and the belt keeps running on the last accepted setpoint, which is the behaviour to test for on the day it is commissioned.
Two smaller ones that cost more than they look
A tag that arrived in an import and has no owner will be wrong eventually, and nothing will report it.
The other is a clock. Publication 1756-UM023B-EN-P has a single line telling you to synchronise the controller clock before enabling the OPC UA engine, and it is the easiest instruction in the manual to read past. Enable the server first and every timestamp that leaves the controller until the next restart is wrong by whatever the drift was, which on a controller that has been running since a power cut in March is not a small number. The trends will still draw. They will just disagree with the ones from the machine next door, and somebody will spend a day on it.
The same manual notes that ControlLogix 5580 redundancy does not support OPC UA at firmware 36 at all, because the communication is only available through the embedded Ethernet port and that port is disabled in a redundant chassis pair. Worth knowing before it is designed in.
What everybody tries first
The loop across the network is sluggish, so the publishing interval gets shortened.
It is the natural move and it makes things worse in a way that takes a while to become visible. A faster subscription is more work for the controller’s communication core, that work shares a budget with CIP Class 3 and sits behind it in priority, and the manual’s own warning is that under high Class 3 demand OPC UA traffic can be rejected outright. So the interval comes down, the controller gets busier, the rejections start, the data arrives less reliably than before, and the symptom reads exactly like the network being slow. The thing that actually fixes it is moving the decision back into the controller, which nobody wants to hear on the afternoon a dashboard is being demonstrated.
Shortening the interval is the one change that cannot help.
What to do on Monday
Take the tag list you are about to publish and mark every entry that could, by any path, cause something to move. Then check what each of those is for: if it is a status bit going up to be looked at, set it Read Only and leave it; if it is a value coming down, put it behind a request area with a validation rung and a refusal code; and if it is part of a safety function, take it off the list and go and read what the function is actually rated to. Then measure the round trip on one tag before you set a rate for forty, and write the number you measured on the drawing.