
PLC Trend Chart Settings And Monitoring
In our previous article, we gave examples of the advantages of trend chart and how to use it in plc. In this article, we will examine how to create a trend chart by writing a program in plc.
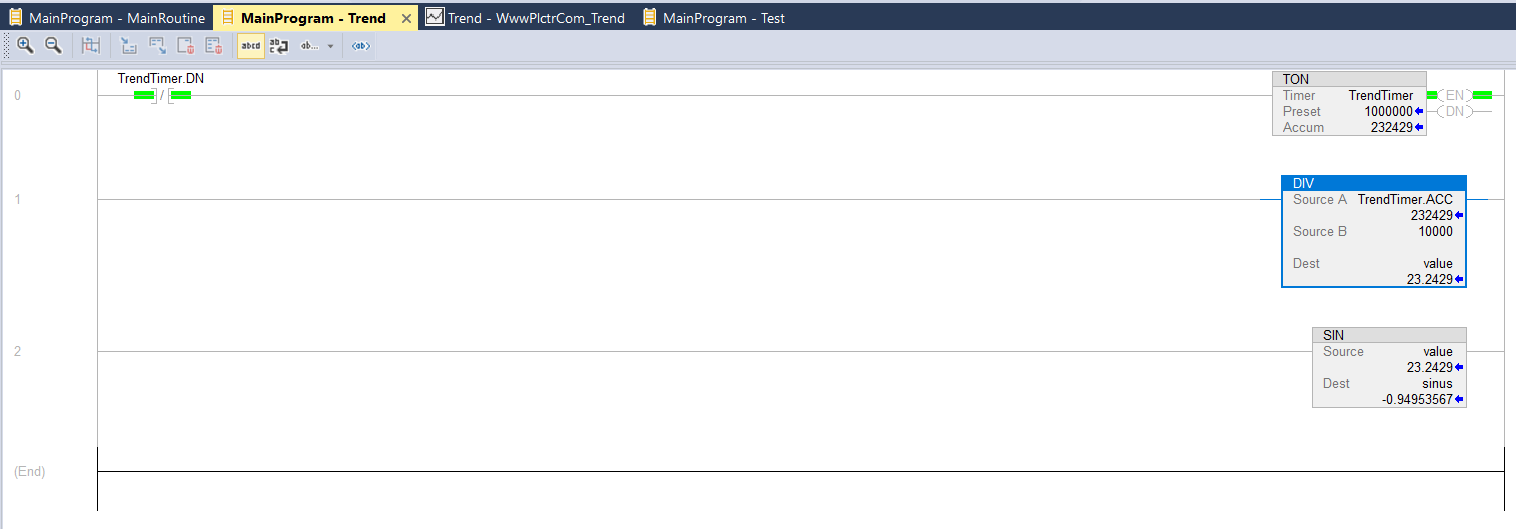
We created a timer for the plc trend chart we will create and a command for the sine function.
As you can see on the 1st line, when the timer reaches the preset value, we ensure that the timer starts again with the done contact for the continuation of the cycle.
In the Assets tab under the Controller organization tab,
We create a new trend chart by right-clicking the Trends folder and clicking the New Trend button.

In the window that opens, we name the Trend chart and determine the sampling period and move to the next setting window with the Next button. I usually select the sampling period as 1000 milliseconds 1 second. This is enough.
If we know the tag name, after typing the tag name in the Select tag section, after clicking the Add button, our Tag name is added. If we don’t know, we have to choose from here.
We added one tag to be an example of the trend chart. You can add more tags if you want.

By pressing the Finish button, we finish adding tags to the PLC trend chart.

Right-clicking the trend chart, we will enter Chart Properties and adjust it.

You can easily adjust the settings by navigating through the tabs in the trend features. You can color the chart by choosing the color and line thickness that suits you.
What is important to you
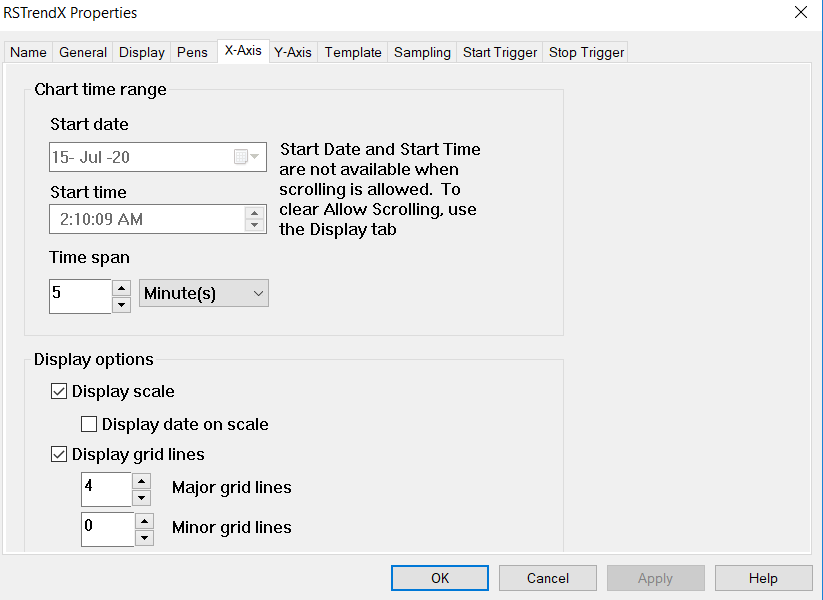
X-Axis: Time chart range: Setting how much data is displayed on the screen
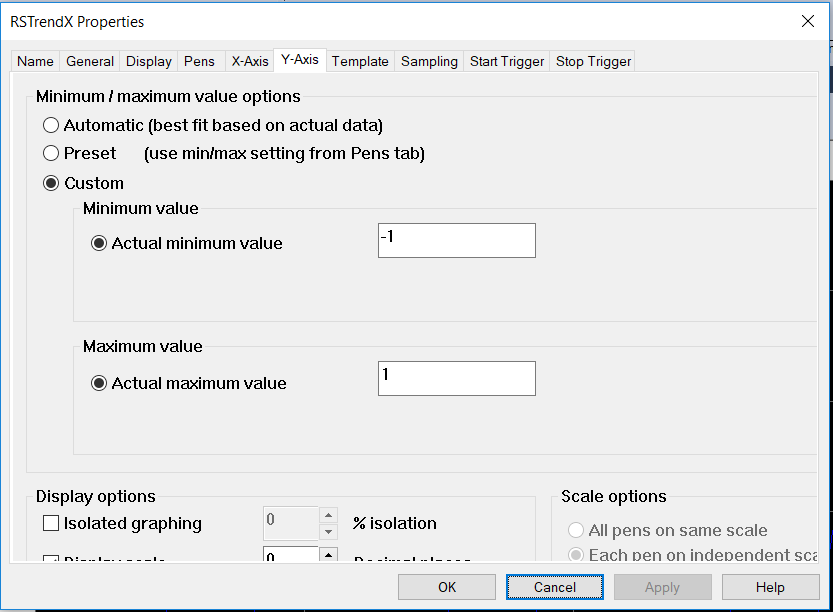
and Y-Axis: Minumum ve Maximum value options: the range on the y axis in the chart.
As an example, we selected Min: -1 Max: 1 because the sine function is in the range of -1 and 1. But you are watching an analog value and if the maximum varies between 100 and 20, you can change these values accordingly. Or if you select the automatic option, it automatically formats the graphic according to the maximum and minimum values of the tag you add.
After our settings are finished, we save it by clicking the Apply button.
And we run our trend by pressing the Run button on the trend chart page.
[irp posts=”3638″ name=”PLC Trend Page Usage, Tag History and Monitoring”]