The utility charges for the highest 15 minute average power in the billing period, so one bad quarter hour in July sets the demand charge for the whole month. A controller can see it coming: kWh so far in the window, plus present kW times the hours remaining, times four, and the prediction crosses a 1000 kW contract limit at minute 3 while there is still time to drop the battery charging bay. This walkthrough covers getting a power meter into a Logix or S7 controller, totalizing kWh so the numbers survive a download, holding the monthly peak under the limit with priority load shedding, and the arithmetic that says whether a drive retrofit is worth the money.
Everything below runs on the machine controller. No cloud, no gateway, no licence.
What you need
| Item | This example |
|---|---|
| Controller | 5069-L320ER CompactLogix 5380, firmware 33, Studio 5000 v33. An S7-1500 with TIA V17 works the same way. |
| Meter at the incomer | PowerMonitor 5000, 1426-M5E, EtherNet/IP |
| Meter at a machine | SENTRON PAC3200, Modbus TCP |
| CTs | Split core, ratio matched to the breaker, not to the cable |
| Task | Periodic task EnergyTask, 1000 ms, priority 10 |
| Storage | Historian or SQL. The controller holds the last shift, nothing more. |
The 1000 ms task is deliberate. Energy is a slow number, and meter reads in a 20 ms task buy nothing.
Step 1: Meter where the money is, not where the panel is
Submetering everything is a waste of CTs. Three rules decide where a meter goes:
- The incomer, always. Without it you cannot check that the submeters add up, and you cannot see the demand peak the utility bills you for.
- Any load over about 20 kW: compressors, chillers, ovens, the main air handler, the big extrusion drives.
- Anything that keeps running when the plant is empty. Those loads hold the easy savings, and they are almost never the ones people guess.
One plant I worked in was certain the presses were the problem. The incomer said the site drew 310 kW on a Sunday with nobody there. Two compressors and a fume extraction fan accounted for most of it.
Step 2: Read the meter into the controller
On the PowerMonitor 5000, install the Add-On Profile, add the meter under the Ethernet port, set the RPI to 1000 ms. The input assembly then shows up as named members instead of raw words. Total real power in kW and the energy accumulators are the two you need. Member names shift between firmware revisions, so browse the tag in the controller rather than copying names off a forum post.
Set the meter’s own configuration before you trust a single number:
- CT primary and secondary, for example 400:5. A wrong ratio scales every reading and looks perfectly believable.
- PT ratio, 1:1 on a 400 V system, something else on medium voltage.
- Wiring mode, three phase four wire wye or three wire delta. Get this wrong and power factor reads nonsense while the voltages look fine.
- Demand window, 15 minutes, to match the utility.
The PAC3200 over Modbus TCP needs a client in the PLC: a MSG
MB_CLIENT from the Modbus TCP library on the S7-1500. Values come back as 32 bit floats, two registers each, big endian, and the register table differs between the PAC3200 and the PAC4200. If total power reads 3.4e-38, the two registers are swapped. Swap them in the copy, not with a calculation.The EtherNet/IP side is covered in EtherNet/IP PLC communication, the Modbus and serial side in PLC communication protocols for SCADA.
Step 3: Totalize kWh in Structured Text
The meter counts kWh. You still want your own counters, because you need them per shift, per product and per machine. Two methods, and you want both.
(* EnergyTask, periodic 1000 ms, routine Totalise, Structured Text *)
H_PER_SCAN := 0.00027778;          (* one second expressed in hours *)

kW_Now := PM5000:I.TotalRealPower;
IF kW_Now < 0.0 THEN
    kW_Now := 0.0;                 (* export from the PV array, not our load *)
END_IF;

(* integration: good for per-shift and per-part numbers *)
kWh_Shift  := kWh_Shift  + (kW_Now * H_PER_SCAN);
kWh_Minute := kWh_Minute + (kW_Now * H_PER_SCAN);

(* delta of the meter's own accumulator: good for the monthly total *)
Ctr_Now := PM5000:I.RealEnergyConsumed;
IF S:FS THEN
    Ctr_Last := Ctr_Now;
END_IF;
Ctr_Delta := Ctr_Now - Ctr_Last;
IF Ctr_Delta < 0.0 OR Ctr_Delta > 500.0 THEN
    Ctr_Delta := 0.0;              (* rollover, meter reset or a bad read, skip it *)
END_IF;
kWh_Meter := kWh_Meter + Ctr_Delta;
Ctr_Last  := Ctr_Now;

(* rolling 15 minute demand from fifteen one minute buckets *)
IF Minute_Tick THEN
    Bucket[Idx] := kWh_Minute;
    kWh_Minute  := 0.0;
    Idx := (Idx + 1) MOD 15;
    Sum := 0.0;
    FOR i := 0 TO 14 DO
        Sum := Sum + Bucket[i];
    END_FOR;
    Demand_kW := Sum * 4.0;        (* quarter hour of kWh becomes an hourly rate *)
END_IF;
Two details people lose a month of data to. Declare kWh_Meter as REAL and the counter stops moving once it passes about 16 million, because a 32 bit float runs out of significant digits. Use a DINT in whole kWh plus a separate fractional REAL. And push the shift total to the historian at the end of every shift, not at month end, because a memory clear or a controller swap takes it with it.
H_PER_SCAN assumes the task really runs every 1000 ms. If it overlaps you will silently undercount. PLC scan time and cycle time has the check for that.
Step 4: Predict the demand peak before you hit it
Most industrial tariffs charge for the highest 15 minute average power in the billing period. One bad quarter hour in July sets the charge for the whole month, and reacting after the meter shows a high number is useless.
So predict. At any moment inside the window:
Predicted_kW = (kWh_so_far + kW_now * hours_remaining) * 4
Lock the window to the clock, because that is how the utility measures it. Start on the quarter hour, not on PLC power up.
| Window minute | kWh so far | Present kW | Predicted demand |
|---|---|---|---|
| 3 | 42 | 870 | 1014 kW |
| 7 | 101 | 900 | 884 kW |
| 11 | 158 | 1150 | 1022 kW |
| 14 | 212 | 1150 | 924 kW |
The contract limit here is 1000 kW. At minute 3 and again at minute 11 the prediction says you will go over. Early in the window it is jumpy, so ignore the first two minutes and act after that.
Step 5: Shed loads in a priority you agreed in advance
What may be shed is not an engineering decision. Take the list to production and maintenance, write it down, and put it on the HMI so the operator can see what the system did and why.
| Priority | Load | kW | Max off | Restore delay |
|---|---|---|---|---|
| 1 | Battery charging bay | 60 | 60 min | 2 min |
| 2 | Air handler AHU-3 | 75 | 20 min | 3 min |
| 3 | Chiller 2 | 110 | 15 min | 5 min |
| 4 | Compressor 3, unloaded standby | 90 | 10 min | 5 min |
| never | Process ovens, safety systems, extraction |
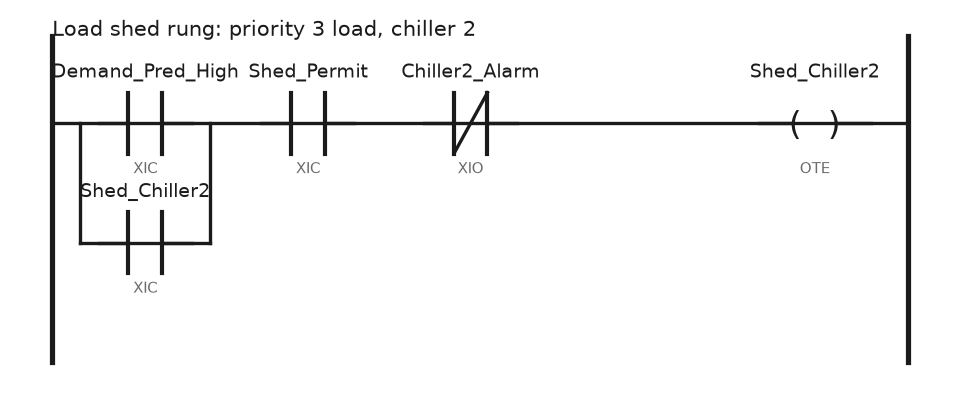
The seal-in matters. Without it the shed output chatters as the prediction crosses the limit, and a chiller that starts and stops four times in a quarter hour burns more than it saved. Give every shed output a minimum off time and a restore delay, and stagger the restores so the list does not come back in one second and set a fresh peak.
Step 6: Do the drive arithmetic before you buy the drive
Fans and centrifugal pumps follow the affinity laws. Flow scales with speed, pressure with speed squared, shaft power with speed cubed.
A 30 kW fan throttled by a damper to 80 percent flow still draws close to 26 kW, because the motor is fighting the damper. The same fan at 80 percent speed on a drive draws about 0.8 cubed of full load, near 15 kW. Over 6000 hours a year at 0.12 per kWh that is roughly 7900 a year from one fan.
The cube law describes the shaft, so add drive and motor losses and any minimum speed the process needs, then use 85 percent of the theoretical figure in a business case. It also only applies to centrifugal loads. A conveyor or a positive displacement pump at half speed uses half the power, not an eighth. The drive side is in PLC motor control and drive systems, the fan and damper side in implementing PLC in HVAC control systems.
Step 7: Find compressed air leaks with a counter, not a soap bottle
Compressed air is usually the most expensive utility in a plant and the least measured. You do not need a flow meter to start. Run a TON off the compressor’s load contact, enable it only while Production_Active is false, and total it per night. A plant that is properly sealed drops to almost zero loaded minutes overnight. Fifteen loaded minutes out of every sixty means you are paying to blow air into an empty building.
A rough conversion for the report: a 3 mm hole at 7 bar passes something like 10 litres of free air per second, which costs 2 to 3 kW at the compressor. Treat that as an order of magnitude. Once the trend exists, the leak survey has a target and a before and after number, which is what an ISO 50001 audit wants. Loaded minutes per idle hour is a better energy performance indicator than total kWh, because it does not move when production moves.
Field notes
The negative kW that was not a fault. A new PowerMonitor read minus 210 kW on phase B. Everyone assumed a meter fault. One CT had been fitted backwards, arrow pointing at the load instead of the source. Look at per phase power before the totals; a reversed CT is obvious there and hides in the sum.
The demand window that never matched the bill. Our system reported a monthly peak of 940 kW and the utility billed 1080 kW. Our window started at controller power up and slid from there, while the utility’s is locked to the clock at the quarter hour. A peak that straddles two of our windows sits neatly inside one of theirs. We resynchronised to the controller’s wall clock and the two numbers came within 2 percent.
Shedding a load that was already off. The shed logic dropped compressor 3 at every peak and the report showed 90 kW saved each time. Compressor 3 was on standby drawing 4 kW. Only count a shed as effective if the meter on that load actually drops.
Meter on the wrong side of the panel. A submeter on a machine’s supply also fed the panel coolers and a socket the cleaners used. The per part energy figure moved with the weather. Check what sits downstream before you name a tag after a machine.
Frequently asked questions
Can I use the PLC’s numbers to bill a tenant or a department?
For internal allocation, yes. For anything that becomes an invoice, use a meter with the right accuracy class and a legal calibration, and read its counter rather than recalculating it. A PLC integration of an analogue power reading is not a revenue meter.
How fast should I poll a power meter?
One second for power, a minute for energy and power factor. The measurement is already averaged over mains cycles inside the meter, so a faster poll returns the same value twice.
Where should the kWh data actually live?
In a historian or a database. Keep the last shift in the controller for the HMI and push the rest out. For a quick start, how to get data from PLC to Excel gets a trial report running in an afternoon, and PLC trend chart settings and monitoring covers the operator view.
Does load shedding cause more trouble than it saves?
It does if you shed process loads, or shed without a minimum off time. Keep the list to thermal storage and comfort loads and it stays invisible to production.
What do I measure first if I have no meters at all?
The incomer, and one week of overnight data. That single trend gives you your base load, the number almost nobody knows and the one that pays for the rest of the project.
Next step
Once the numbers are trustworthy, the same meters tell you when a machine is degrading. A motor drawing 8 percent more current for the same cycle is a bearing, not a bill, and that work is in PLC condition monitoring and predictive maintenance. To get the totals into a plant system instead of a spreadsheet, start at integrating PLC with MES.