Vibration at 2.8 mm/s on a machine with 400 running hours means something different from the same 2.8 on one with 40,000 hours, which is why the runtime counter is the denominator for everything else here. ISO 10816-3 puts the zone boundaries for a rigidly mounted medium machine near 1.4, 2.8 and 4.5 mm/s RMS, and a pump that always ran at 1.6 and now runs at 2.4 is telling you something while still sitting inside every one of those bands. This is the middle path for PLC predictive maintenance: pick the failure modes worth catching, measure them with hardware you already have, keep the maths in the controller, and send maintenance three numbers instead of three hundred. Code is Studio 5000 v33 structured text on a 1756-L83E.
Nothing here needs a machine learning platform. It needs a runtime counter, a moving average and an honest baseline.
What you need
| Item | Notes |
|---|---|
| Controller | 1756-L83E or CompactLogix 5380. Any controller with spare memory and a periodic task |
| Vibration input | Dynamix 1444 module for permanent monitoring, or a wireless velocity sensor reporting over Modbus TCP for the cheap version |
| Motor data | PowerFlex 525 or 755 already reports output current, torque and thermal state over EtherNet/IP. No extra hardware |
| Analog spares | Two channels for differential pressure or temperature on a filter or a cooler |
| Historian | FactoryTalk Historian or Ignition with the tag historian module. Setup context: IIoT data from PLC systems |
| A maintenance planner who wants the data | Skip this and the project dies in month three |
Pick failure modes, not sensors
Start from what actually breaks on the line, then work back to a measurement. The list on a typical packaging line comes out short.
| Failure mode | What it does to a signal | Where the signal comes from | Sample rate |
|---|---|---|---|
| Bearing wear on a gearbox | Overall velocity in mm/s rises, then envelope acceleration rises earlier | Dynamix 1444 or wireless sensor | 1 per second, trend hourly |
| Motor rotor or load problem | Current RMS drifts up at the same speed and load | Drive parameter over EtherNet/IP | 100 ms, average to 1 s |
| Belt slip | Driver speed and driven speed diverge | Two proximity sensors or encoders | 10 ms |
| Valve sticking | Stroke time from command to limit switch grows | PLC timer, no new hardware | Every stroke |
| Filter clogging | Differential pressure rises for the same flow | Two analog inputs | 1 per second |
| Cooler fouling | Approach temperature climbs over weeks | Existing temperature loops | 1 per minute |
Three of those six need no new instruments. Valve stroke time is the best value in the whole table: a TON started on the command and stopped on the limit switch, with the accumulated time trended, predicts a sticking valve weeks ahead and costs nothing.
Count runtime hours, because everything else needs them
Vibration at 2.8 mm/s on a machine with 400 hours means something different than the same reading at 40,000 hours. Runtime hours are the denominator for every other number, and they are trivial to produce.
(* Runtime hours and starts. 1000 ms periodic task, Studio 5000 v33 ST *)

IF Motor_Run_Fb THEN
    Eq.Sec_Acc := Eq.Sec_Acc + 1;
    IF Eq.Sec_Acc >= 3600 THEN
        Eq.Sec_Acc  := 0;
        Eq.Run_Hours := Eq.Run_Hours + 1;
    END_IF;
END_IF;

(* start counter, rising edge of the run feedback *)
IF Motor_Run_Fb AND NOT Eq.Run_Last THEN
    Eq.Starts := Eq.Starts + 1;
END_IF;
Eq.Run_Last := Motor_Run_Fb;

(* service due, reset by maintenance from the HMI *)
Eq.Hours_To_Service := Eq.Service_Interval - (Eq.Run_Hours - Eq.Last_Service_Hours);
Eq.Service_Due      := (Eq.Hours_To_Service <= 0);
Put Eq in a UDT and make one instance per motor. Keep the instances in controller scope, never in a program that gets copied, and make sure the tag is not initialised on download. A runtime counter that resets when someone downloads is worse than no counter, because people trust it.
Starts per hour matter as much as hours. A motor rated for six starts an hour that is being cycled fifteen times will fail on thermal stress long before the bearings wear out, and the starts counter is the only place that shows up.
Smooth the signal before you compare it to anything
Raw vibration and raw current jump around. Alarm on the raw value and you get a call every time a forklift hits the frame. A moving average over sixty samples with the machine running is enough for a slow degradation signal.
(* 60 sample moving average, 1 s task. Ax is a UDT instance per point *)

IF Machine_Running AND Warmup_TMR.DN THEN

    Ax.Sum        := Ax.Sum - Ax.Buf[Ax.Idx];   (* drop the oldest *)
    Ax.Buf[Ax.Idx]:= Vib_Velocity;              (* store the newest *)
    Ax.Sum        := Ax.Sum + Vib_Velocity;
    Ax.Idx        := Ax.Idx + 1;

    IF Ax.Idx >= 60 THEN
        Ax.Idx    := 0;
        Ax.Filled := 1;
    END_IF;

    IF Ax.Filled THEN
        Ax.Avg := Ax.Sum / 60.0;
    END_IF;

    (* deviation from the learned baseline, in percent *)
    IF Ax.Baseline > 0.1 THEN
        Ax.Dev_Pct := 100.0 * (Ax.Avg - Ax.Baseline) / Ax.Baseline;
    END_IF;

END_IF;
Two details that stop this being useless. The average only updates while the machine is running and warmed up, so idle readings do not drag it down. And Ax.Filled keeps the alarm logic quiet until the buffer has real data, which is the difference between a system that alarms on restart and one that does not.
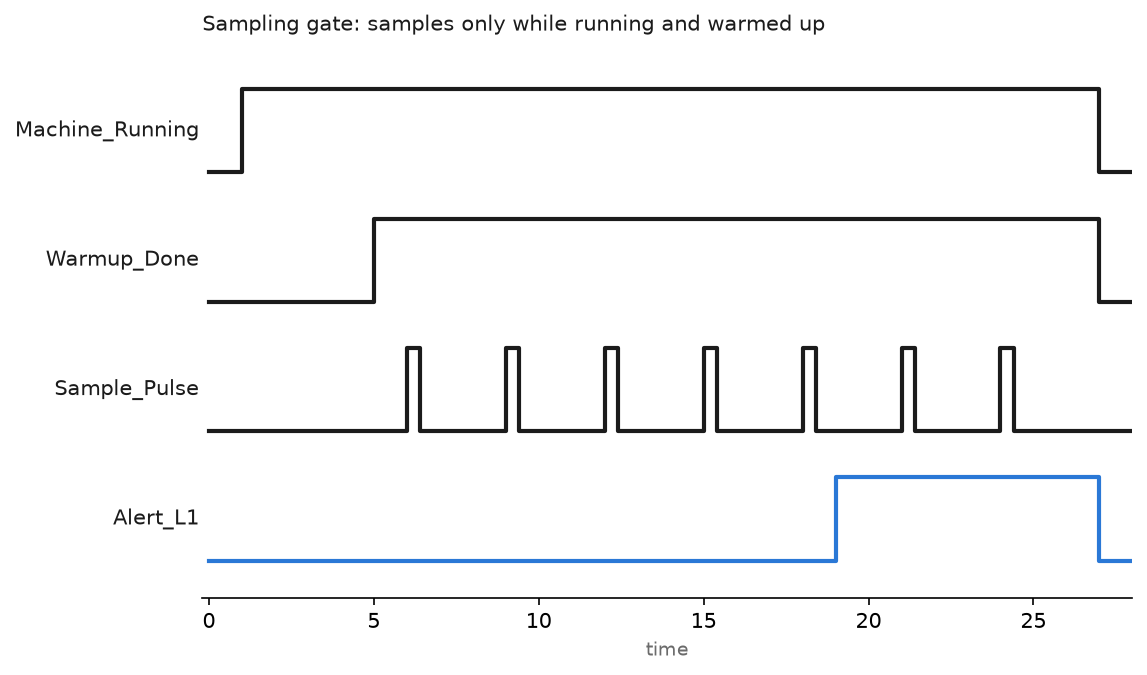
The chart is the sampling gate in practice. Sampling starts only after the warm-up timer expires, because a cold gearbox reads high for the first few minutes and those samples poison the average. The alert at the right side sets after the average sat above the limit long enough to be real, not on a single high reading.
Thresholds and baselines do different jobs
Both belong in the system. They answer different questions.
An absolute threshold says the machine is outside what the design allows. ISO 10816-3 gives velocity bands by machine size and mounting. For a rigidly mounted medium machine (15 to 300 kW, roughly the Group 2 class in the standard) the zone boundaries run around 1.4, 2.8 and 4.5 mm/s RMS; a flexibly mounted machine in the same group gets a higher set of boundaries. Use the standard’s own table for the hard stop, not the numbers above from memory. They are defensible in a meeting because a standard wrote them, not you.
A learned baseline says the machine has changed. Capture the average over the first two weeks of healthy running at the normal load, freeze it, and alarm on deviation. A pump that always ran at 1.6 mm/s and now runs at 2.4 is telling you something even though it is inside every published band.
Baselines have to be per product and per speed. The same conveyor gearbox reads differently with a full load than with an empty belt, so store one baseline per running mode and select it with the recipe number. Trying to use one baseline for everything is what creates the noise that kills these projects.
Set up alarms so they reach the right person
Three levels, and nothing goes to the operator screen.
| Level | Condition | Who sees it | Action |
|---|---|---|---|
| Advisory | Deviation above 20 percent for 4 hours | Maintenance planner, daily report | Add to the next planned stop |
| Alert | Deviation above 50 percent, or ISO zone C | Maintenance supervisor, email | Inspect within the week |
| Urgent | ISO zone D, or a step change over 100 percent in one hour | Control room and maintenance | Plan a stop now |
Every level needs an on-delay and a deadband. A four-hour on-delay on the advisory level removes almost all nuisance events by itself. Alarm instruction behaviour and deadband setup are covered in PLC alarm instructions.
Get the data out without drowning the historian
The controller keeps the averages, the deviations, the runtime hours and the counters. The historian keeps the history. Log on change with a deadband, not on a timer, and the numbers stay manageable.
A practical set per machine is about a dozen tags: average vibration per point, current average, runtime hours, starts, valve stroke time, differential pressure, plus the deviation percentages. A dozen tags at a 1 percent deadband is nothing. Two hundred raw analog tags at 100 ms will fill a disk and nobody will thank you.
For the weekly report the planner actually reads, a spreadsheet pull is usually enough. The mechanics are in how to get data from PLC to Excel, and the on-screen trend for the technician standing at the machine is in PLC trend page usage, tag history and monitoring.
Field notes: what actually goes wrong
The magnet on painted steel. A wireless vibration sensor was stuck to a painted gearbox housing with its magnet base. Overall velocity looked fine, high frequency content was flat and useless, and the bearing failed with no warning. Paint and a magnet base act like a spring above a few hundred hertz. Stud mount on a spot-faced clean surface, or accept that you only get low frequency data.
Four years of runtime lost on a download. Runtime counters lived in program scope inside a routine that got copied into a new project during an upgrade. The tags initialised to zero on download and nobody noticed for a month. Now the counters live in a controller-scoped UDT array and get exported to a CSV every Sunday night.
Current baseline that moved with the product. A mixer motor alarmed every time the plant ran the heavy recipe. The baseline had been captured on the light one. Adding a baseline per recipe index and selecting it from the active recipe number ended the false alarms in one afternoon.
Alerts nobody could act on. The first version emailed every vibration alert to the shift operators. They could not do anything about a rising trend on a gearbox at 2 a.m., so they started ignoring the emails, including the one that mattered. Route condition alerts to the planner and the maintenance supervisor. The operator screen only gets the urgent level.
Soft foot after a motor swap. Vibration doubled the day after a motor replacement and everyone blamed the new motor. It was a 0.4 mm gap under one foot. Always re-baseline after mechanical work, and note the reason for the re-baseline in the log, otherwise you have quietly accepted a new fault as normal.
Frequently asked questions
Do I need a dedicated vibration module or is an analog input enough?
An analog input reading a 4 to 20 mA overall velocity transmitter gives you a usable trend for slow-speed bearing wear. A Dynamix 1444 or similar gives you the spectrum and envelope data that shows a fault weeks earlier. Start with the transmitter on ten machines rather than a spectrum analyser on one.
How long should I collect data before I set limits?
Two weeks of normal running per operating mode, minimum. One week is not enough to see the weekly cycle of product changes, cleaning and shift patterns.
Should the maths run in the PLC or in the historian?
Averages, counters and deviation percentages go in the PLC because they are cheap and they survive a network outage. Spectral analysis and cross-machine comparison belong upstream, where there is real processing power.
What sample rate do I need for vibration?
For overall velocity, once a second into the moving average is plenty. For spectral data you need the raw waveform, which stays in the vibration module and never touches the PLC scan.
Can I predict a failure date from a trend?
Sometimes, and never precisely. A linear fit to the last thirty days gives a usable estimate for slow wear. Treat it as a planning aid for the next scheduled stop, not as a promise.
Next step
Get one machine instrumented end to end before you scale it. Once the tags exist, the reporting side is covered in remote monitoring and control of PLC systems, and the motor behaviour behind the current signature is worth reading in electric motors.