Four lines of Python on a Raspberry Pi 4 read a CompactLogix tag – a REAL out of a 5069-L306ER – and nothing at either end is licensed. pycomm3 1.2.16 speaks EtherNet/IP to TCP port 44818 itself, which takes the OPC server, the Windows box it used to live on and the licence out of the middle. Nine pages on this site explain how to get data out of a Logix controller and all nine put a product in that gap – Kepware, FactoryTalk, Ignition, a gateway appliance with a part number. This one you can run tonight on hardware you already have, and the rest of the page is about what doing it this way costs you.
One thing to know before you build on it. pycomm3 is MIT-licensed and independent, which means it is somebody’s implementation of the protocol rather than a Rockwell product, and every behaviour below belongs to the library and not to the controller vendor – I have attributed them separately throughout for that reason. Its own README also carries a line worth reading twice: the project is no longer actively developed. That is not a reason to avoid it for a logger or a test rig. It is a reason not to put it under something that has to run for ten years.
Read a CompactLogix tag in four lines
Install it, point it at an address, and ask for the tag by the name it has in Studio 5000.
from pycomm3 import LogixDriver

with LogixDriver('192.168.1.10') as plc:
    print(plc.read('Zone7_Speed'))

# Tag(tag='Zone7_Speed', value=30.0, type='REAL', error=None)
pip install pycomm3 on Raspberry Pi OS and that runs – no compiled dependency, no EDS file, no driver to register, and the library wants Python 3.6.1 or newer, which every current Pi image is well past. What comes back is a Tag, a named tuple of four fields: the tag name, the value, the Logix data type as a string, and an error. The library defines the truth value of a Tag as true when the value is not None and the error is None, so the thing to test is the object, never the value it carries.
result = plc.read('Zone7_Speed')
if result:
    log(result.value)
else:
    log_error(result.error)
That distinction is not cosmetic, and it is the first bug in every logger written against this library. A BOOL that is genuinely false, an INT that is genuinely zero and a read that failed outright all look the same to if result.value:, so code written that way throws every zero on the line into the bin and then records nothing at all, silently, for the whole of the night the controller was unreachable. The gap in the data looks like a quiet shift.
Test the Tag object itself. Never the value sitting inside it.
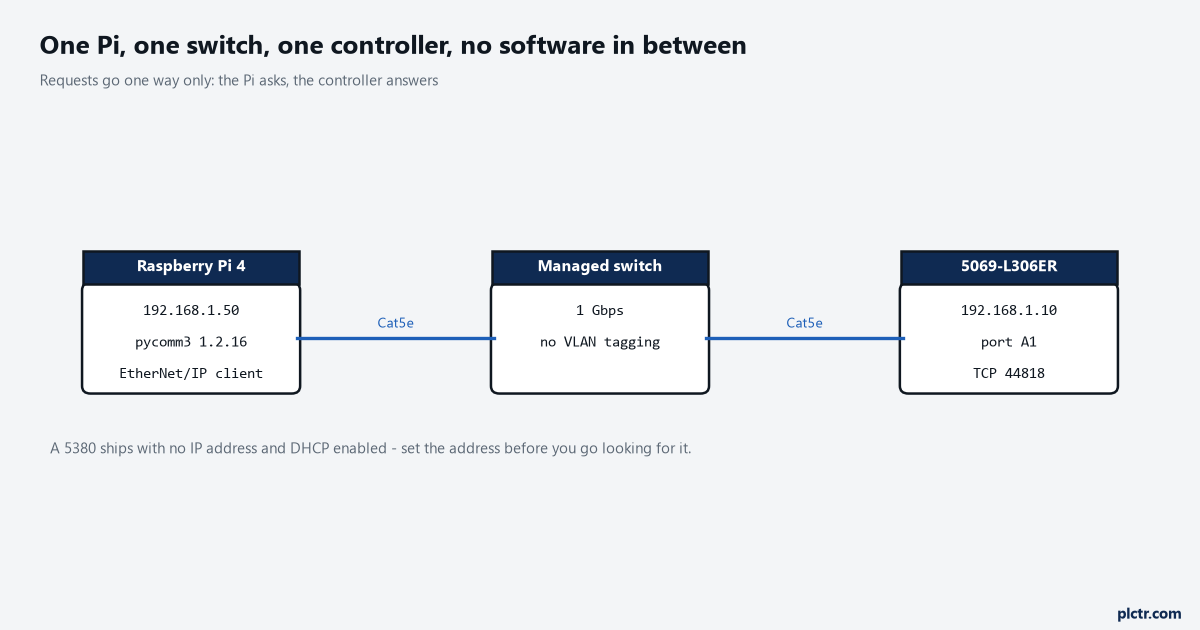
The Pi is a client on the same subnet as the controller’s port A1. Nothing is bridged and nothing is routed. Worth knowing before you go looking for the controller: a 5380 ships with no IP address and DHCP enabled, so out of the box it has whatever your DHCP server gave it, or nothing.
The path, and the slot that catches ControlLogix people out
Three forms are documented, and the short ones expand into the long one.
An IP address on its own is for a controller in slot 0, or for a CompactLogix, which has no chassis slot to speak of. An address with a slot number after it is for a ControlLogix sitting somewhere other than slot 0, and the full CIP route – backplane, slot, enet, address, backplane, slot – is what the other two are turned into internally, and what you need when the controller is behind a bridge. Point a bare IP address at a ControlLogix in slot 2 and the connection fails with a message about the path rather than about the slot, which sends people to the network when the fault is one character of configuration.
CompactLogix people never meet this. ControlLogix people meet it once.
An array without fifty round trips
Curly braces after the tag name ask for a count of elements.
plc.read('ZoneSpeeds{12}')                # twelve elements of an array
plc.read('Zone[7].JamPreset')             # one element by index
plc.read('Program:MainProgram.Cycles')    # a program-scoped tag
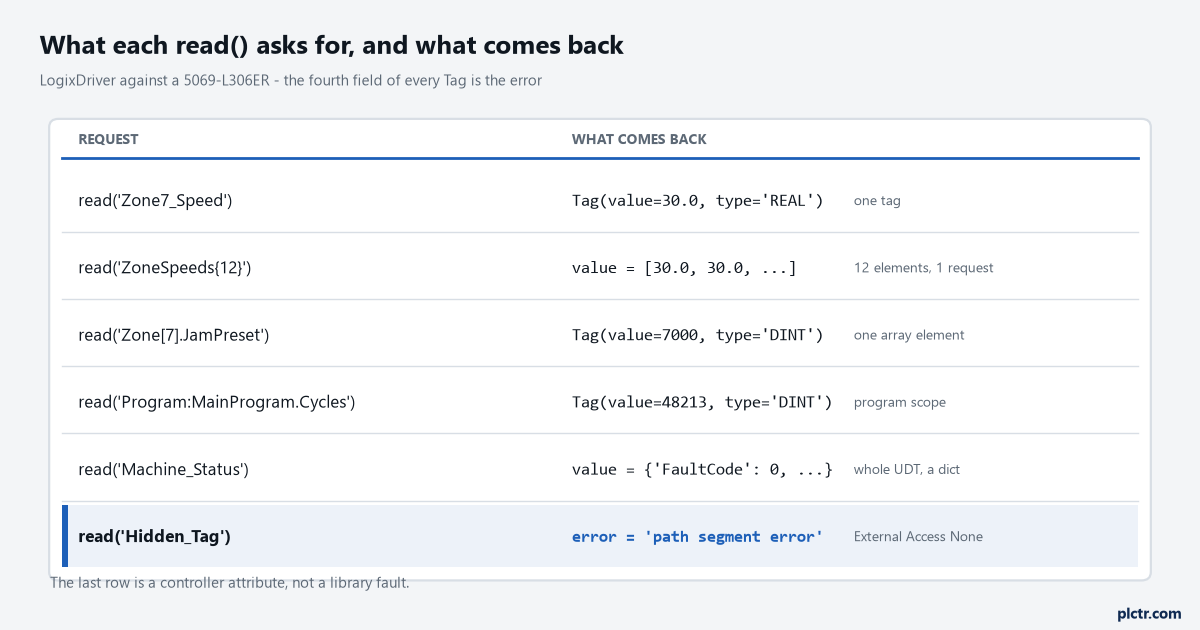
Six requests and what each hands back. The bottom row is not a library fault – that tag has its External Access set to None in the controller, and no client on any protocol will read it.
read() takes any number of tag names in one call, and the library packs them into the CIP Multiple Service Packet service, tracking the request and response size as it goes so it stays inside the connection size – which it negotiates, asking for an Extended Forward Open and a 4000-byte connection and falling back to 500 bytes when the extended open is refused. Where the data will not fit it splits the work across more than one request on its own. The consequence is about how you write the loop rather than how fast you run it: forty separate read() calls are forty request-and-response round trips, while one read() carrying forty tag names is one, or two if the answer outgrows the connection. On a Pi on the same switch that difference is tens of milliseconds. Over a VPN to a site an hour away it is the difference between a one-second poll and a poll that cannot keep up with itself.
One call carrying forty names. Forty calls carrying one name each. The same data, a very different network.
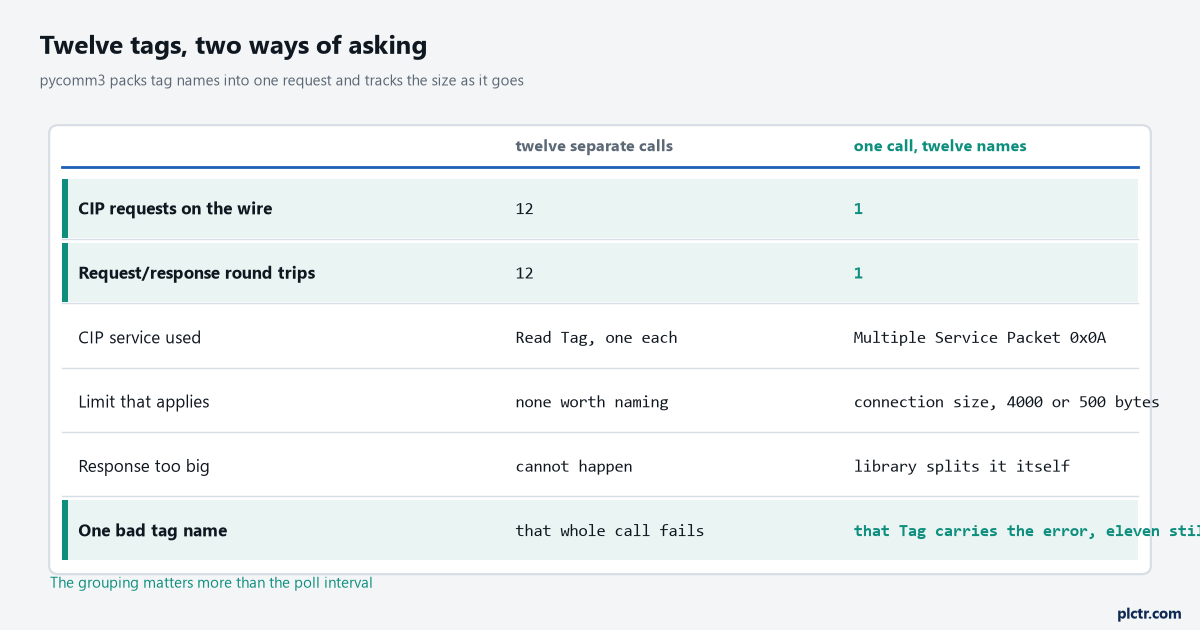
Grouping tags into one call is the only optimisation here that costs nothing. The failure behaviour differs too – one bad tag in a grouped read returns its own error in its own Tag and the other eleven still come back.
A UDT member, and the attribute that can stop you reading anything
Dotted names work the way they do in Studio 5000, so a UDT member is just a tag name.
A whole structure can be read in one call, and the library’s documentation is precise about the condition: reading an entire structure works as long as none of its attributes has an external access of None, and the value comes back as a dict of attribute name to value, while writing one back needs every attribute to be Read/Write. That is the library describing a controller-side property that people forget exists. External Access is a per-tag attribute in Logix with three settings – Read/Write, Read Only and None – and Rockwell’s description of it in the Logix 5000 Controllers I/O and Tag Data programming manual, 1756-PM004, names third-party software directly as the thing it governs. A tag set to None cannot be read from outside the controller at all, and one member of a UDT set to None takes the whole structure read down with it. That is a five-minute fault wearing the costume of a ten-hour one: the tag exists, the name is spelled right, the connection is up, the network capture looks healthy, and the read still fails.
Check the attribute in the tag editor before you open Wireshark. The UDT examples on this site show where it sits in the tag properties.
How hard can you poll it
Honestly: harder than you would guess, and I cannot give you the controller’s number, because Rockwell does not publish one for this controller.
Here is what is published, which is worth knowing precisely because of what it does not cover. The EtherNet/IP Network Devices user manual, ENET-UM006, carries a specification table of TCP connections, CIP connections and packets per second for HMI and messaging traffic – and every row in that table is a communication adapter or bridge, a 1756-EN2T or a 5069-AENTR. The 5380’s own embedded Ethernet port is not a row in it. What the CompactLogix 5380 user manual, 5069-UM001, gives per catalogue number is a maximum EtherNet/IP node count: 16 nodes on a 5069-L306ER, 90 on a 5069-L340ER, 180 on a 5069-L3100ERM. Node counts are not packet rates. Anybody quoting you a polls-per-second figure for a 5380 has it from somewhere other than Rockwell literature, and it is worth asking where.
Two published numbers do apply, and both are useful. The first is a rule of thumb from the same manual: reserve 10% of a device’s packets-per-second bandwidth for temporary explicit messaging, which is exactly the category a Python client falls into – your polling is explicit messaging, the same class of traffic as an HMI screen or a MSG instruction, not the cyclic I/O that has an RPI. The second is a timeout. An explicit message times out in 30 seconds by default, a completely different mechanism from the multiplier-times-RPI timeout that governs cyclic connections, which means a client that stalls does not fault the controller’s I/O tree – it just sits there being slow while everything else carries on.
So measure rather than guess, and measure the right thing.
Open the driver once and keep it open instead of reconnecting every cycle, because a connect costs a session registration, a forward open and – unless you turn it off – an upload of the controller’s tag list. Then trend the controller’s task scan time while you wind the poll interval down, and when the scan time starts to move you have your answer for your controller, your tag count and your program, which is the only answer that was ever going to be true. The scan time article covers how to read that number properly rather than off the front screen.
One more thing about that tag list. LogixDriver uploads it at connect by default so it can decode types for you, and the documentation says plainly that it can take a few seconds on a large program – on a controller with several thousand tags that is a few seconds of dead time every single restart of your service, and it is one constructor argument away from being skipped.
When the link drops
The link goes down as a CommError exception, and nothing in the library reconnects for you.
The socket carries a five-second timeout by default, and both a timeout and a broken connection surface as CommError with a message about the socket rather than as a timeout class of their own. Six exception types exist in the library and the two you will write code around are CommError for connection trouble and ResponseError for a controller that answered with something you did not want. Nothing in the documented API reconnects after a drop, and nothing subscribes: there is no callback, no change-of-state push, no unsolicited message anywhere in the published interface. Your process polls, or your process gets nothing.
Which puts the reconnect loop and the buffer in your code, where they belong.
import sqlite3, time
from pycomm3 import LogixDriver, CommError

TAGS = ['Zone7_Speed', 'Zone7_Jam', 'Line_Count']
db = sqlite3.connect('/var/lib/plctr/buffer.db')
db.execute('CREATE TABLE IF NOT EXISTS q (ts REAL, tag TEXT, val TEXT)')

while True:
    try:
        with LogixDriver('192.168.1.10', init_tags=False) as plc:
            while True:
                ts = time.time()                  # stamp at the read, not at the upload
                for r in plc.read(*TAGS):
                    if r:
                        db.execute('INSERT INTO q VALUES (?,?,?)', (ts, r.tag, str(r.value)))
                db.commit()
                drain_to_cloud(db)                # deletes only what the far end acknowledged
                time.sleep(1.0)
    except CommError:
        time.sleep(5.0)                           # the switch, the cable, or a download
Three things in that sketch carry the whole argument. The timestamp is taken on the Pi at the moment of the read and stored alongside the value, so a backfill an hour later does not quietly claim the data happened an hour late – which is the failure that makes a whole month of history useless for arguing about a downtime event. The rows are deleted only once the far end has acknowledged them, never when they are sent. And the reconnect is the outer loop, because a controller download, a switch reboot and somebody pulling the wrong patch lead all look identical from the Pi and all three end the same way: the driver is dead, and a new one has to be built. A download is worth its own note, since the tag list uploaded at connect can be stale afterwards, and letting the exception kill the driver is the cheapest cure there is.
Where a Pi is the wrong answer
Four questions decide it and none of them are about Python.
Does anything stop if this device stops? If the answer is anything beyond “a dashboard goes stale”, the Pi is in the wrong job. A logger that dies quietly is an inconvenience; anything that writes a setpoint, gates a sequence or stands in an interlock belongs in the controller, where it can be seen and tested.
What is that panel like in August? Ambient inside a sealed enclosure in a hot aisle is not the ambient on any datasheet, and the consumer-grade board does not carry the margin the DIN-rail one does. Read both datasheets rather than either reputation.
Who owns it in three years? An industrial edge device has a catalogue number, a spare on a shelf and a published lead time. A Pi has whichever model was in stock that week, an SD card with a finite number of writes, and an operating system that will need patching by somebody who has since left.
Will the site’s IT policy allow it? This is the one that kills the project after the work is finished rather than before it starts, and an unmanaged Linux box on the process network is a conversation to have first.
None of those four have an answer that is the same on every site.
Where the Pi wins is exactly where the licence hurts most: proving a tag can be read at all before anybody raises a purchase order, logging eight tags off one machine for a fortnight to settle an argument about cycle time, bridging one stubborn device that nothing else will talk to. The moment the thing runs a plant rather than reporting on one, price the hardened box properly and compare it against a year of your own evenings keeping a hobby computer alive.
Next step
Read one tag from your own controller and time the round trip – time.perf_counter() either side of the call, a hundred times, and look at the spread rather than the average, because the spread is what tells you about the network between you and that panel. Then decide whether the data should leave the building at all: remote monitoring without open ports is the outbound-only pattern that gets this past a security review, and data logging and remote monitoring covers what to do with the rows once they land somewhere. If it turns out you need an OPC server after all, OPC UA from PLC tag to SCADA client is the road this article deliberately drove around.