48,000 rows is what a Raspberry Pi reading 20 tags a second has to hold through a 40-minute outage, and the SQLite file that held them in the run behind this article was 5.3 MB, including the write-ahead log. That is the size of the buffering PLC data problem, and it is small. What is not small is the row that gets deleted before the far end acknowledged it, and the row that arrives an hour late stamped with the time it arrived instead of the time it was true. Both are one line of code, both are the default when you do not think about them, and this page is the version that does.
The shape: one table, one insert per cycle, one drain per cycle that sends the oldest rows and deletes only what was acknowledged. The IIoT gateway article turns store-and-forward on as a setting on a product with a part number; this is what that setting is doing, built on the board you already have, with the numbers measured.
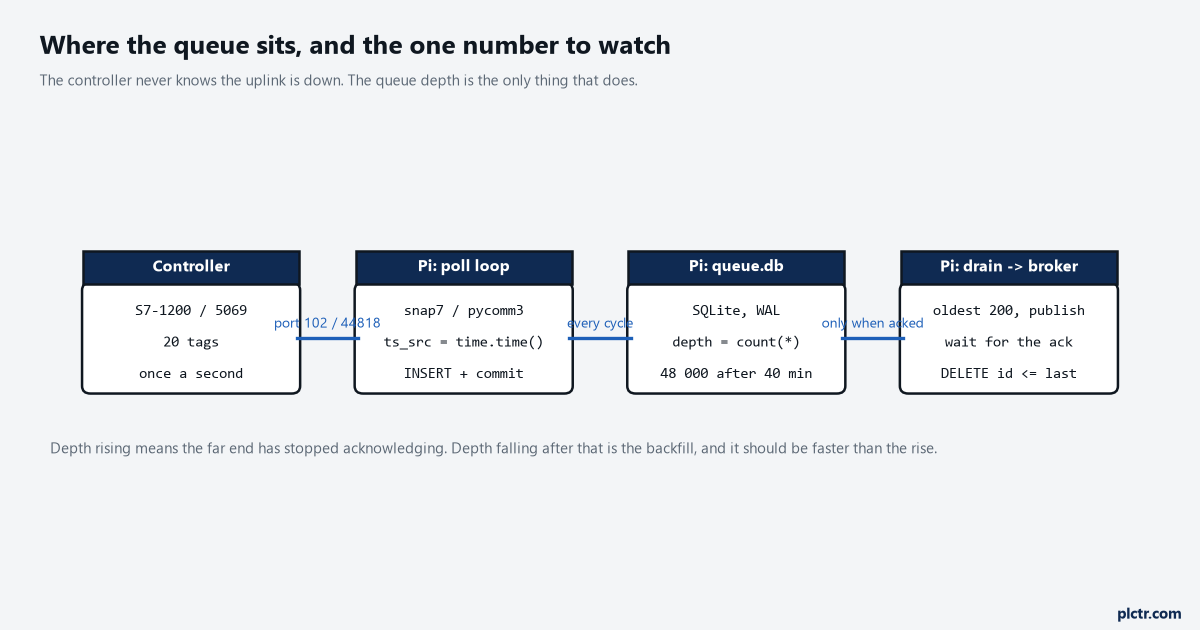
The controller never finds out the uplink is down. The queue depth is the only thing on the path that knows, which is why it is the number to alarm on, not the broker’s connection state.
The table and the rule for buffering PLC data
The whole design is one table plus one rule, and the rule is: delete nothing the far end has not acknowledged.
import sqlite3, time

db = sqlite3.connect('/var/lib/plctr/queue.db', timeout=10)
db.execute('PRAGMA journal_mode=WAL')
db.execute('PRAGMA synchronous=NORMAL')
db.execute('''CREATE TABLE IF NOT EXISTS q (
    id     INTEGER PRIMARY KEY,
    ts_src REAL NOT NULL,      -- Pi clock at the moment of the read, UTC epoch seconds
    tag    TEXT NOT NULL,
    val    TEXT NOT NULL)''')

def enqueue(rows):                       # rows: [(ts_src, tag, val), ...] from one poll cycle
    db.executemany('INSERT INTO q (ts_src, tag, val) VALUES (?, ?, ?)', rows)
    db.commit()

def drain(send, batch=200):
    rows = db.execute('SELECT id, ts_src, tag, val FROM q ORDER BY id LIMIT ?', (batch,)).fetchall()
    if not rows:
        return 0
    if not send(rows):                   # True only when the far end acknowledged this batch
        return 0
    db.execute('DELETE FROM q WHERE id <= ?', (rows[-1][0],))
    db.commit()
    return len(rows)
id INTEGER PRIMARY KEY is the queue. SQLite hands out rowids in increasing order, so “the oldest 200 rows” is ORDER BY id LIMIT 200, and because every row inserted later has a larger id, DELETE FROM q WHERE id <= last_sent removes exactly the batch that was sent and nothing that arrived during the send. No sent flag, no second pass, no index beyond the one the primary key gives you. executemany for the insert is one statement per cycle for all 20 tags, and the commit() after it matters more than it looks: Python’s sqlite3 module, in its default transaction mode, opens a transaction implicitly before an INSERT or DELETE and does not close it until you say so, and a poll loop that never commits is a poll loop whose rows are not on disk. Python 3.12 added an autocommit attribute that makes this explicit; a Pi on the Debian 12 base is still on 3.11 – python3 --version settles it – so the legacy behaviour is the one most scripts get, and one commit()
journal_mode=WAL is persistent – set it once and the file remembers – and in WAL mode readers do not block the writer, so a sqlite3 queue.db 'select count(*) from q' from a shell while the loop runs does not stall the loop. synchronous=NORMAL in WAL mode is the compromise: commits are durable except across a power failure or hard reset, where the documentation says the last transactions might roll back. For a queue that is refilled from the controller every second, losing the final second before a power cut is acceptable and the write cost of FULL on an SD card is not. If that trade is wrong for your data, say FULL and measure what it costs you. One more line from the same page that decides where the file lives: WAL does not work over a network filesystem, so queue.db goes on the card or a local USB stick, never on the NAS share somebody set up for the CSV exports.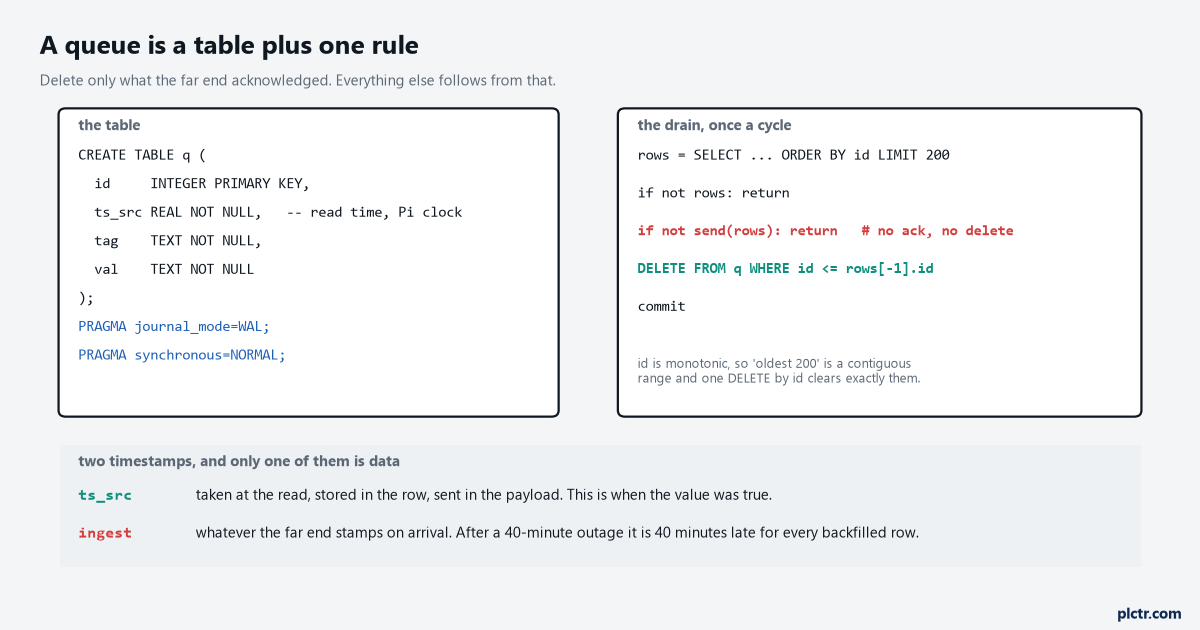
The red line is the article. The ts_src row underneath is the other half of it: a value is only worth backfilling if it carries the time it was true.
What “acknowledged” means, and what it does not
send() returns True when the far end said it has the rows. Not when the socket accepted the bytes.
import json
import paho.mqtt.client as mqtt
from paho.mqtt.enums import CallbackAPIVersion

cli = mqtt.Client(CallbackAPIVersion.VERSION2)
cli.reconnect_delay_set(min_delay=1, max_delay=60)
cli.connect_async('broker.plant.local', 1883, keepalive=60)   # connects when it can, keeps trying
cli.loop_start()

def send(rows):
    payload = json.dumps([{'ts': r[1], 'tag': r[2], 'val': r[3]} for r in rows])
    info = cli.publish('line4/pi1/data', payload, qos=1)
    try:
        info.wait_for_publish(timeout=5)
    except (ValueError, RuntimeError):     # queue full, or not published for another reason
        return False
    return info.is_published()
With paho-mqtt 2.1.0 a publish at QoS 1 returns an MQTTMessageInfo, and wait_for_publish(timeout=5) blocks until the broker’s PUBACK has come back or five seconds have passed; is_published() afterwards is the answer. The project’s own README is precise about what that ack is: for QoS 1 it is the PUBACK from the broker. So “acknowledged” here means the broker has the message. It does not mean the database behind the broker has it, and if the broker is a cloud service that persists to something else, that something else can still lose it. If that gap matters, the far end has to answer with something the Pi can check – an HTTPS POST that returns 200 only after the insert committed is the plain version, and urllib.request does that in eight lines with no library at all. Either way the rule is the same: the delete happens after the answer, never after the send. The dead end is the version where send() returns True when publish() returns. It looks right for weeks. The broker goes down, publish() at QoS 1 with the network loop running queues the message in the client and returns immediately with a message info, the script deletes the rows, and 40 minutes of history is now in a Python list inside a process that will be restarted by systemd before the broker is back. Nothing logged an error, because nothing failed. wait_for_publish with a timeout is the difference, and it is one line.
A second one, smaller. connect_async plus loop_start is what makes the script survive the broker being down at boot: connect() raises if the host is unreachable, and a script that raises on line six never reaches the poll loop, so the queue never fills and the controller data of the whole outage is gone before it was ever read.
The two timestamps
ts_src is taken at the read and stored in the row, and it is the only time that is data.
ts = time.time()                                 # once per cycle, before the reads
rows = [(ts, r.tag, str(r.value)) for r in plc.read(*TAGS) if r]
enqueue(rows)
Whatever the far end stamps on arrival – ingest_time, received_at, the row’s creation time in the cloud table – is a fact about the network, not about the machine. After a 40-minute outage every backfilled row arrives 40 minutes or more late, and a dashboard that plots ingest time shows a flat line, then a vertical wall of 48,000 points, then normal service. A dashboard that plots ts_src shows the machine running through the outage as if nothing happened, because nothing did happen to the machine. Send ts_src in the payload as the record time and keep the ingest time as a second column for diagnosing the network. The pycomm3 article takes the stamp the same way, once per cycle before the reads, so that all 20 tags of a cycle carry one time rather than twenty slightly different ones. Which clock time.time() is reading, and what happens to it across a reboot without a network or across the autumn clock change, is a page of its own and it is coming; for the queue the rule is only that the stamp is taken at the read, in UTC, and stored with the value.
What the outage looks like from the queue
The evidence is a run of the code above with the uplink stubbed to refuse for 40 minutes, 20 tags a second, one drain of up to 200 rows per cycle, time compressed so the run takes seconds and the SQLite work is real.
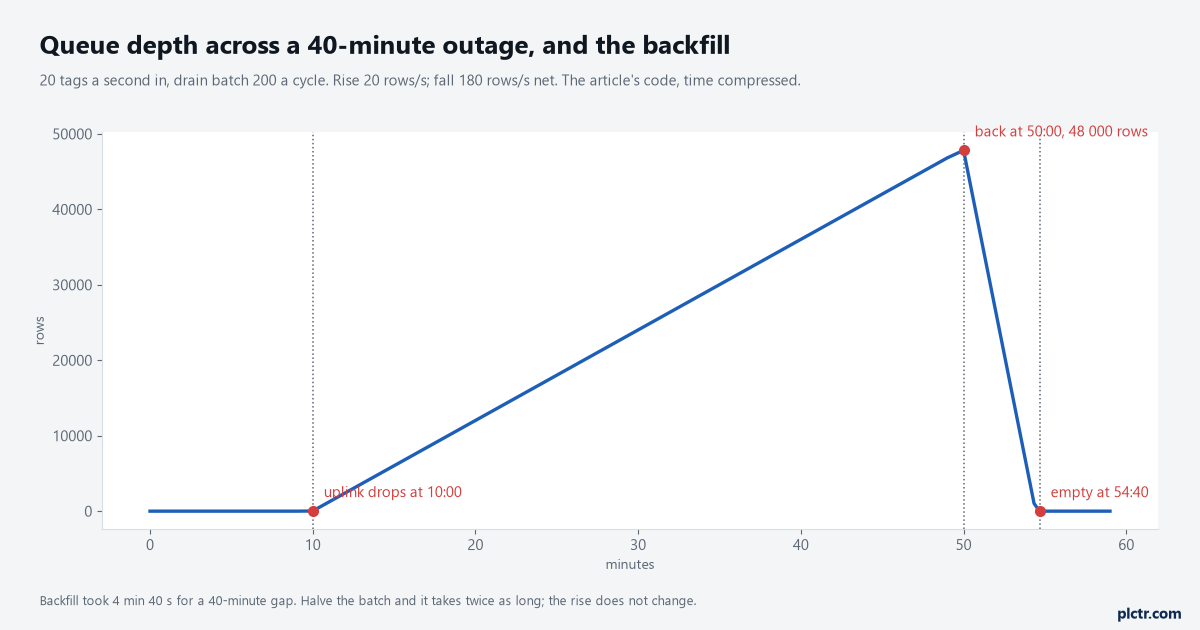
Rise at 20 rows a second, fall at 180 a second net – 200 sent less the 20 new ones each cycle. The backfill of a 40-minute gap took 4 minutes 40 seconds.
Three things in that trend are design decisions rather than facts of nature. The slope of the rise is your tag count times your sample rate and nothing else; cut either and the queue grows slower, and how often you sample is a question worth asking before the outage rather than during it. The slope of the fall is the batch size less the arrival rate, so a batch of 200 a second against 20 arriving drains at 180 a second, and a batch of 40 would take 40 minutes to clear a 40-minute gap, which is the moment somebody starts calling it broken. And the batch is one publish: 200 rows as one JSON array is one PUBACK to wait for, where 200 separate publishes would be 200 round trips, each with its own five-second timeout available to go wrong. Size the batch so the backfill is faster than the outage by a margin you would defend in a meeting. Ten times faster is a reasonable place to start. What the trend does not show is the machine. On this laptop an insert of 20 rows with commit took a median of 0.04 ms and a worst case of 15.6 ms, a drain of 200 rows 0.05 ms median; on a Pi with the queue on an SD card those numbers will be larger and the worst case, which is the card’s write latency showing through the commit, is the one to measure, with exactly this script and your card. I have not run it on your card, and the difference between card brands on commit() is bigger than the difference between Pi models.
The card, and when to stop keeping data
Bytes per row measured on this schema: 110, including the write-ahead log’s share.
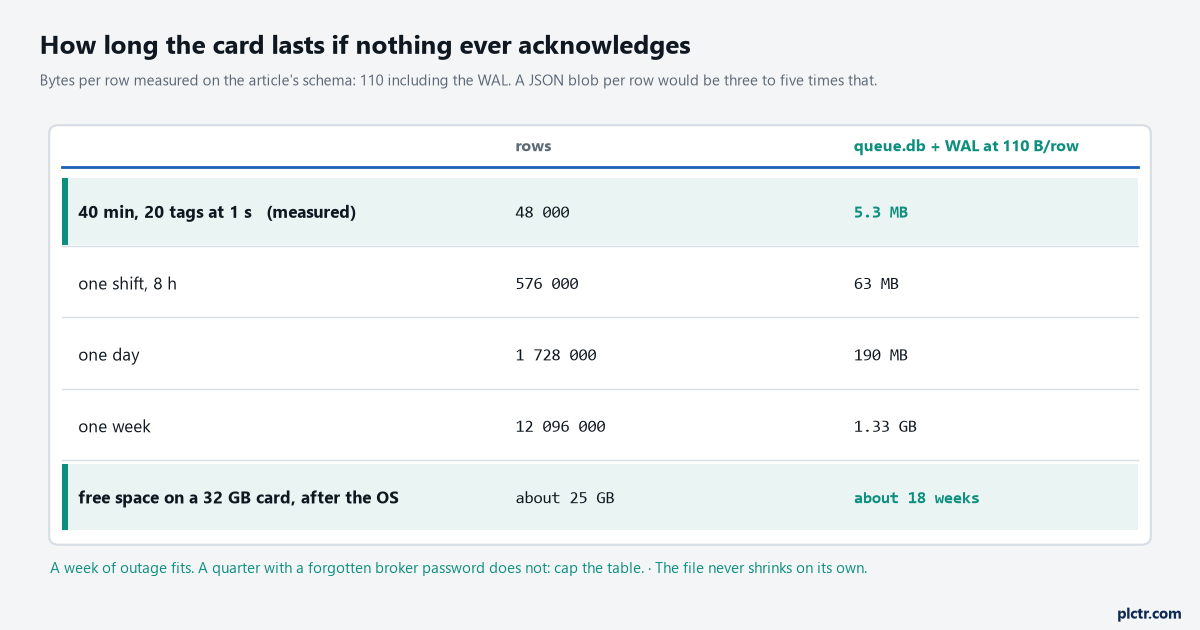
A week of outage fits comfortably. A broker password that expired in April and nobody noticed until July does not, and that is the failure to design for, not the network blip.
Cap the table and log the cap. SELECT count(*) FROM q once a minute, and above a limit you chose – a week’s worth is a defensible number – delete the oldest rows in blocks and write one line to the log saying so, with the count, because the alternative is a full card, a database that cannot write, and a poll loop that dies with sqlite3.OperationalError at three in the morning having stopped reading the controller as well as stopped uploading. Losing the oldest week of a two-week outage is a smaller failure than losing the ability to log at all. The timeout=10 in connect() is the companion setting: it is how long a write waits when another connection holds the lock before raising OperationalError: database is locked, and a monitoring script that opens the file in the default rollback mode while the loop is mid-commit is the usual cause; WAL removes most of it and ten seconds covers the rest. Deleting rows does not shrink the file. The pages go on SQLite’s free list and are reused by the next inserts, so the file settles at the high-water mark of the worst outage it has seen and stays there, which is fine. VACUUM rewrites it smaller if the space is needed, and it is not something to run from the poll loop.
Next step
Run the queue with the uplink deliberately unplugged for ten minutes, on the Pi, on the card it will live on, and watch three numbers: the depth rising at the rate you calculated, the worst-case commit() time, and how long the backfill takes once the cable goes back in. If the backfill is not several times faster than the outage, raise the batch. Then unplug the Pi’s power mid-run and count what came back, because that is the test synchronous=NORMAL was a bet on, and it is better to know the answer on a bench. The controller-side half of getting the values in the first place is in the snap7 and Modbus TCP articles, and both of them hand you rows shaped exactly for enqueue().