Line 2’s palletiser infeed stops about once a shift with Infeed_Jam latched, the alarm log says “Infeed jam” with a time, and the 1756-L83E, the PowerFlex 525 and the 1756-IB16 feeding the discharge photo-eye all check out every time somebody looks. Whatever happens takes a few tens of milliseconds and happens hours apart, and the alarm names the last thing in the chain rather than the first. A PLC intermittent fault of that shape needs an instrument that was already recording when it happened, and the controller can be that instrument: a 10 ms periodic task writing eight tags into a 600-element ring, a trigger on the fault bit, 200 more samples, then a latch that stops the writer until somebody has read the result.
Four rungs. About 7 KB of memory. It caught the cause on the second shift.
That is the whole method, and the rest of this page is which eight tags, why 10 ms and not 1 s, what the trigger has to be, what the latch has to survive, and how to read a ring buffer so the order of events falls out of it. The Logix Designer trend under Assets in the project tree is the tool most people reach for first, and building one of those charts is covered on this site already; the last section says why it was not enough here. On an S7-1500 the same job is a trace with a trigger and a pre-trigger, built into the CPU. On a Logix controller you build it.
What goes in a PLC intermittent fault trend, and at what rate
Record the trip, the things that can cause the trip, and the raw inputs behind those things. Nothing else.
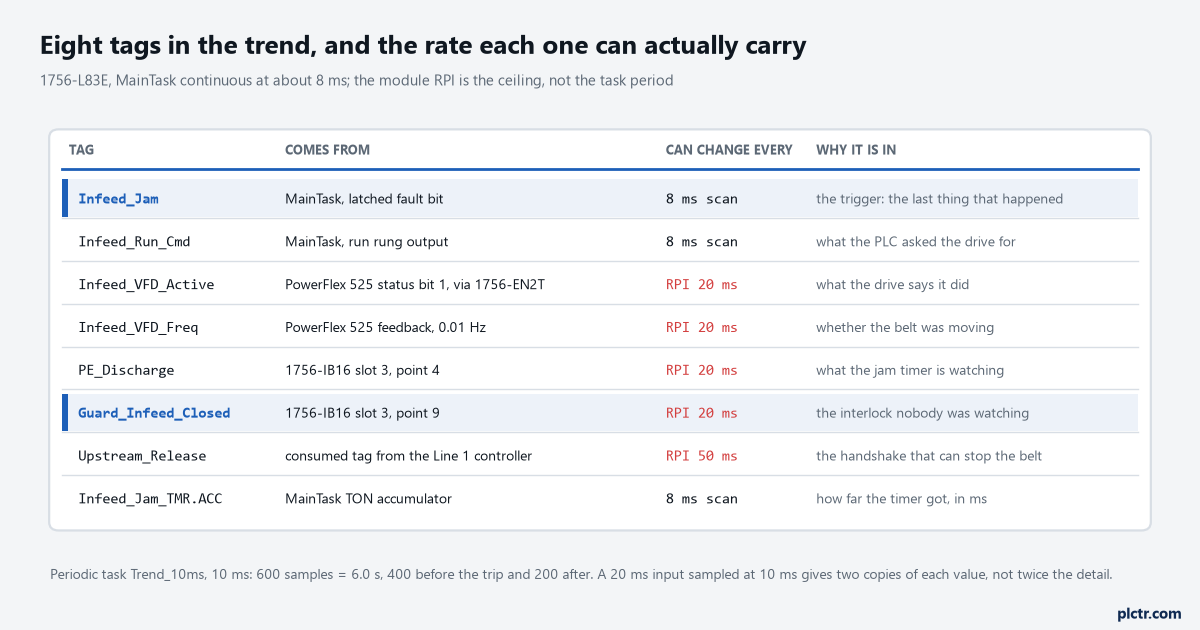
The task samples at 10 ms; the module RPI is the ceiling on what each tag can carry. A 20 ms input sampled at 10 ms gives two copies of every value, not twice the detail.
On the infeed that is eight: Infeed_Jam itself, because the trigger needs it and because the capture should show the moment it latched; Infeed_Run_Cmd, what the program asked the drive for; the PowerFlex 525’s Active status bit and its output frequency feedback in 0.01 Hz, both through the 1756-EN2T at a 20 ms RPI, which together say what the drive did and whether the belt was moving; PE_Discharge, the eye the jam timer watches, on point 4 of the 1756-IB16 in slot 3; Guard_Infeed_Closed, on point 9 of the same card, an interlock status input that feeds the run rung; Upstream_Release, a consumed tag from the Line 1 controller at 50 ms, because a handshake that drops is a reason the belt stops that nobody remembers; and Infeed_Jam_TMR.ACC, the jam timer’s accumulator, so the capture shows how far the timer got and when it started counting. The point of the last one is that a timer’s .ACC turns a bit that changed at some moment into a ramp with a slope, and a slope is what tells you the timer started 3.0 s before the trip and not 0.3 s. Every one of those eight is either a bit or a DINT-sized number, so a sample is five BOOLs, an INT and a DINT in a user-defined type, about 12 bytes as Logix packs it, and 600 of them are roughly 7 KB, which on an L83E is nothing. The tags people add and should not are the ones that cannot have caused it: the HMI’s setpoints, the recipe number, the shift counter. They cost memory, they cost a MOV a sample, and they make the read-out harder to look at.
The rate column in the figure is the part that decides whether the effort pays off, and it is not the task period. The Design Considerations manual, 1756-RM094, says the backplane CPU sends and receives I/O asynchronous to program execution, and its RPI guideline says to set the RPI at half the interval you need data at, 40 ms for data you need every 80, so that you sample twice as often and, in its words, no faster, because the data is asynchronous to the scan and a faster read only returns the same value again. Turned round, the same rule bounds the trend: a task at 10 ms reads the 1756-IB16 at the card’s 20 ms RPI, and a guard input that opened for 8 ms may be seen as one 20 ms low sample or not seen at all, depending on where in the RPI it fell. That is the ceiling, and it is set by whoever configured the module. Two more numbers from the same manual matter on other hardware: on EtherNet/IP a module configured for change of state holds the changed data at the adapter until a quarter of the RPI has passed, and a CompactLogix transmits at powers of 2 ms, so an RPI typed as 100 ms actually runs at 64. If the tag you care about is a drive status bit at 20 ms, the trend cannot order two events that happened 5 ms apart, and it should not pretend to.
Sample at the fastest RPI in the list, and know that the slower tags repeat.
Why the rate is a periodic task and not a rung in MainTask
A rung in the continuous task samples whenever the scan happens to come round, which on this machine is about every 8 ms and on a bad scan is 14. The timestamps drift, and a capture whose sample spacing wanders is hard to read for the one thing you want out of it, which is order.
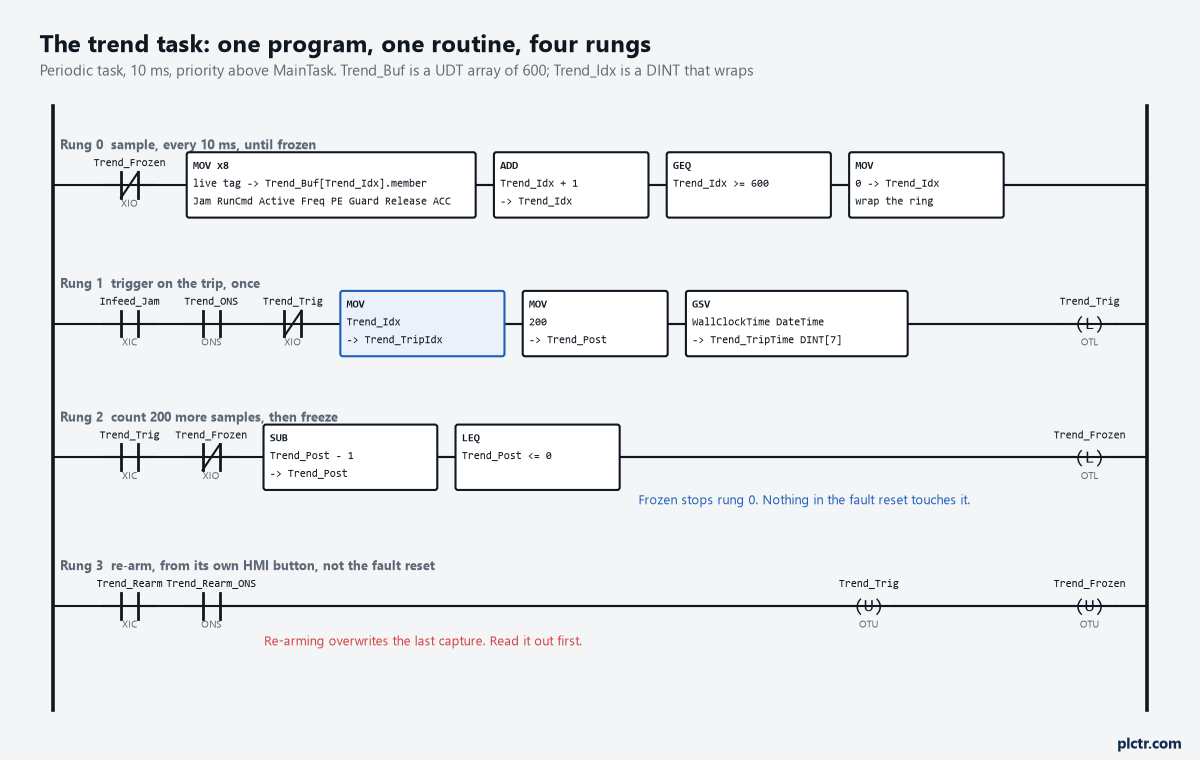
Rung 0 is the only writer and Trend_Frozen is the only thing that stops it. Nothing in the machine’s fault reset touches Trend_Frozen; rung 3 is a separate button.
So the sampler goes in its own periodic task, and 1756-PM005 gives the numbers: a period from 0.1 ms to 2000 s, default 10 ms, and a warning that the period must be longer than the sum of the run times of the programs in it, because a trigger that arrives while the task is still running is a minor fault called an overlap. Eight MOVs and an ADD run in a few microseconds, so 10 ms is a comfortable period and priority 5 puts it above MainTask without getting in the way of anything faster. Set it and then check the Task object’s OverlapCount with a GSV after a shift; 1756-RM018 documents it as the number of times the task was triggered while still executing, and it should read 0. The reason to use a task at all rather than a faster continuous scan is worth stating: a periodic task interrupts MainTask at its period whatever MainTask is doing, so every sample is 10 ms from the last one to within the jitter of the task switch, and the read-out can treat sample number as time. That is also why the Logix Designer trend behaves as well as it does at fast periods: the priority table in 1756-RM094 lists trend data collection above every user task, so the controller collects those samples itself. What the built-in trend does not do is keep them in the controller, and that is the whole reason for building this one.
One writer, one period, one ring. Trend_Idx runs 0 to 599 and wraps.
Rung 0 writes with an indirect address, Trend_Buf[Trend_Idx], which is the mechanism 1756-PM004 describes for logging error codes and stepping through arrays, and it carries the one fault you can give yourself here. If Trend_Idx ever reaches 600 while a MOV runs, the controller takes a major fault, type 4 code 20, array subscript out of range, and now the trend has stopped the machine. The GEQ and MOV at the end of rung 0 wrap the index to 0 in the same rung, after the ADD and before the next sample, so the index is always inside the array when the writes happen. Do not size the array 600 and test for 601.
The trigger that catches the cause, and the latch that keeps it
Trigger on the trip, not on the thing you suspect. The suspect is what the capture is supposed to find, and if you already knew which input to trigger on you would not need the trend.
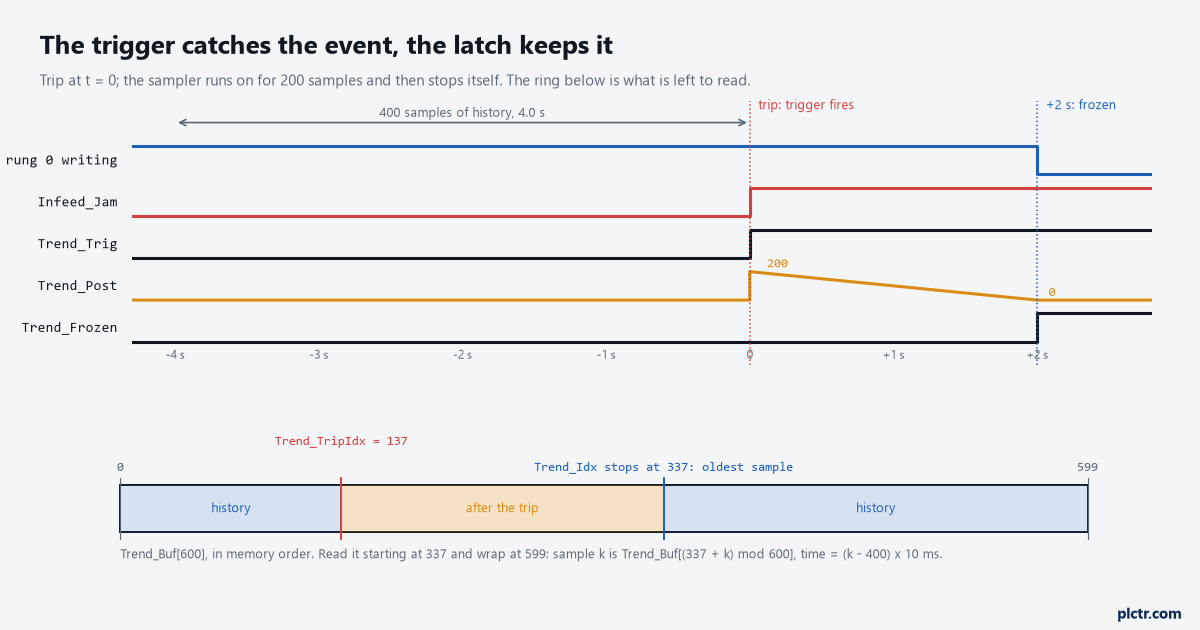
The sampler runs on for 200 samples after the trip and then stops itself. Trend_TripIdx marks where the trip landed in the ring; Trend_Idx stops 200 later, and that is where the oldest sample is.
Infeed_Jam rising is the trigger, through a ONS so it fires once, and behind an XIO of Trend_Trig so a second trip during the post-count cannot restart it. On that one scan rung 1 copies Trend_Idx into Trend_TripIdx, loads 200 into Trend_Post, and takes a GSV of the WallClockTime object’s DateTime
Trend_Post down by one each sample and latches Trend_Frozen when it reaches zero, and Trend_Frozen is the XIO at the front of rung 0, so the writer stops with 400 samples of history and 200 of aftermath in the ring. The 400 and 200 are a choice, and the choice is about the machine: a jam timer with a 3 s preset means the belt could have stopped 3 s before the alarm, so 4 s of history is enough to see the stop and 1 s of margin before it, and 2 s after shows what the fault logic and the drive did once the fault latched. On a machine whose trip is a 30 s timeout, the ring is 60 s deep and the task period goes to 100 ms, because 10 ms over 60 s is 6000 samples of tags that cannot change faster than a second.What the latch has to survive is a longer list than it looks, and the list is why the freeze is a latched bit and not a rung condition. The operator’s fault reset clears Infeed_Jam, and if the trigger were level-sensitive or the freeze were tied to the fault, the reset would re-arm the ring and the next 6 s of a normal restart would overwrite the evidence; rung 3 is a separate Trend_Rearm from its own HMI button for exactly that reason. Program mode and back to Run does nothing to tag values, so a maintenance stop between the trip and the read-out is fine, and prescan does not touch a plain DINT array. A power cycle is its own question on Logix, and the short version is that the tags in a 5570 or 5580 come back if the energy storage module did its job, and there is no Retain column to check. A download from the office copy of the project overwrites every tag with the value in the file, ring included, which is the one thing in the list that has actually cost me a capture. And an upload after the trip brings the tag values with it, ring included, which is worth knowing when the read-out has to happen on a different laptop.
An FFL looks like the right instruction for this and is not. 1756-RM018 says the FFL loads one value each time it is enabled until the FIFO is full, and the .DN bit then inhibits loading until .POS drops below .LEN. It fills once and stops; it does not wrap. An FFL/FFU pair with an FFU on every sample once the FIFO is full does make a ring, at the cost of a copy of the whole array every 10 ms, and the indexed MOV with a wrapping DINT does the same job for one ADD. The FIFO pair is the right tool when you want an ordered queue that something else empties; a trend is not that.
Reading the result: the order things happened in
The ring is in memory order, not time order, and unwrapping it is one line: sample k is Trend_Buf[(Trend_Idx + k) mod 600], its time relative to the trip is (k - 400) × 10 ms, because Trend_Idx stopped exactly 200 past the trip and therefore points at the oldest sample.
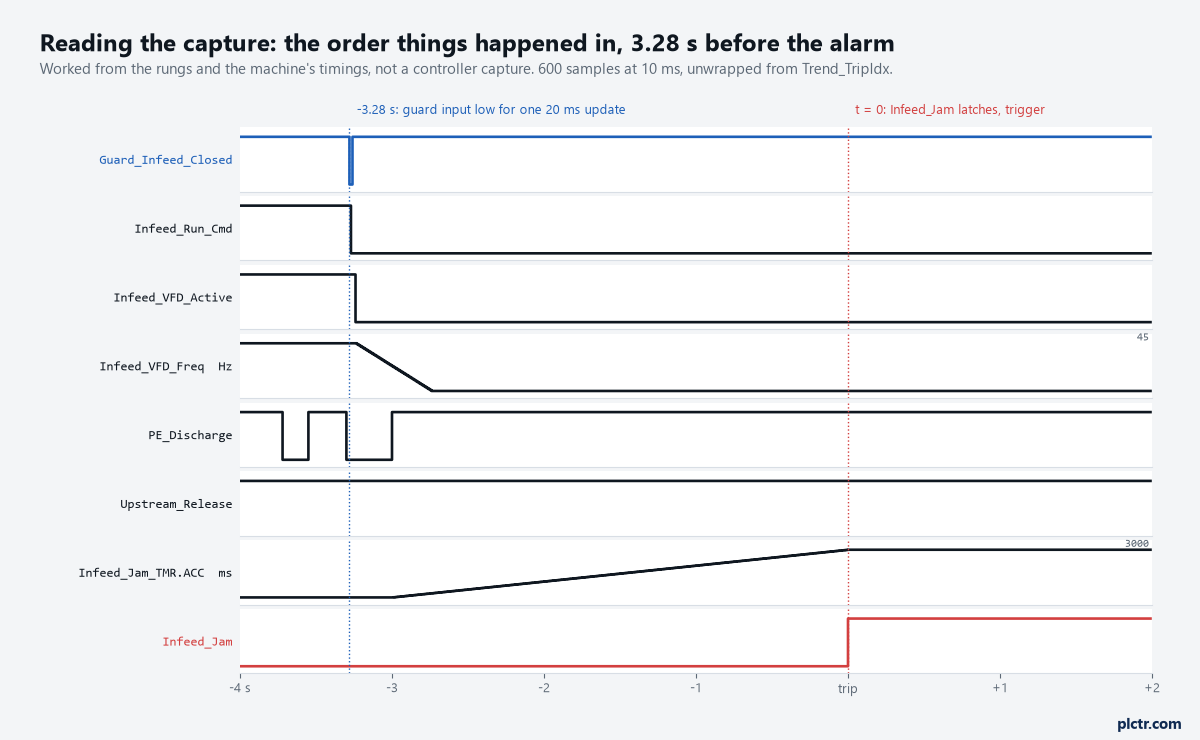
Worked from the rungs and this machine’s timings, not a controller capture. The alarm said jam; the first thing to move was the guard input, 3.28 s earlier, for one 20 ms update.
Getting the 600 samples out is the easy half. On this line a Raspberry Pi on the machine network reads the array with pycomm3 in one call, plc.read('Trend_Buf{600}'), and a dozen lines of Python unwrap it and plot it the way figure 4 is drawn; without a Pi, the Monitor Tags grid in Logix Designer lets you select the value column of an expanded array and paste it into a spreadsheet, which is slower and works. Then the read itself, and this is the part that is not obvious the first time: do not stare at the traces, list the last change of every tag before the trip and sort the list by time. On the second-shift capture that list read guard input low at -3.28 s for one update, run command off at -3.27 s, drive Active off at -3.24 s, output frequency starting down from 45.00 Hz at -3.24 s and at zero by -2.74 s on a 0.5 s decel, the discharge eye going blocked at -3.00 s and staying blocked, the jam timer’s .ACC starting to climb at -3.00 s, and Infeed_Jam at 0. Read in that order the story writes itself: the guard-closed input dropped for one 20 ms update, the run rung seals in through that contact with no debounce so the run command fell on the next scan, the drive stopped, a carton that was 100 mm short of the eye coasted onto it as the belt decelerated, and the jam timer, which on this machine runs on eye-blocked and zone-released rather than on the run command, counted its full 3000 ms and latched the alarm. The guard-open alarm rung has a 500 ms TON in front of it, so nobody ever saw a guard alarm. Two rungs looked at the same input with two different ideas of how long a real event lasts, and the alarm log only reported the second one. The bracket on the guard door’s magnetic sensor had worked loose, and the palletiser’s layer push, two metres above, shook the door enough to open it for a few milliseconds once a shift.
The alarm names the last thing. The trend names the first.
What the capture could not say is what the input did inside its 20 ms update, and it is honest about that: one sample low means the card saw it low at one RPI, and the real gap was somewhere between a millisecond and 20. That was enough to send somebody to the door with a hand on it while the palletiser cycled, and the jam timer preset was not the problem, though it was the first thing everyone wanted to change.
What everyone tries first, and why it was not enough here
The Logix Designer trend, with the laptop left on the panel. It was set to a 1 s sample, because that is the number everyone uses and it is the number the older article on this site recommends for watching a process value, and it caught the trip twice. Both captures showed the run command, the drive Active bit and the guard input already in their final state in the same sample, because 1 s cannot order events 10 ms apart, and the third night the laptop went to sleep. A 1 s trend is the right tool for a tank level that drifts over an hour, and the wrong one for a bit that is low for one update. The tag history logger on the Pi has the same limit for a different reason: its arithmetic is built around a year of data at 1 s with a deadband, and a deadband is designed to throw away exactly the small short change you are hunting.
Triggering on the suspected input is the other one. The first version of this trend triggered on PE_Discharge, because the alarm said jam and the eye was the obvious culprit, and it froze forty times a shift on cartons passing normally. The trip is the only event you are sure is the event.
Put the task in tonight, with Trend_Rearm on a maintenance screen and Trend_Frozen shown next to it so the morning shift can see whether it fired. When it has, read Trend_TripTime first and match it to the alarm log, unwrap the ring from Trend_Idx, and write down the last change of every tag before the trip in time order before anybody touches the machine.