Zone 3 of the takeaway conveyor stops about once a shift with "Zone3".Fault latched, the photo-eye on %I4.3 reads a steady 1 in every watch table anybody has opened, and the CPU 1516-3 PN/DP is turning OB1 over in about 6 ms. Whatever is happening is happening inside one of those 6 ms passes, hours apart, and no amount of staring at program status will be looking at the right pass. An S7-1500 trace is the instrument that does.
This is the job the trace function exists for, and nothing else on the CPU does it.
The CPU records up to 16 signals at the end of every OB1 pass, into its own memory, without a laptop attached, and stops when a condition you chose comes true, keeping as much history before that moment as you asked for. The three settings that decide whether the glitch is in the recording are the reduction factor, the trigger tag and the pre-trigger, and the mistakes people make are on exactly those three. Everything below about what the trace does is from the STEP 7 system manual’s trace chapter and the older trace function manual, which say the same things in slightly different words. The 6 ms cycle and the zone-3 signals are this machine’s; the captured trace in the figures is worked from the manual’s sampling rule rather than pulled off a CPU, and the captions say so.
What an S7-1500 trace is, and where in the cycle it samples
In the project tree under the CPU there is a Traces folder. Add new trace, and the configuration has two parts: Signals, where you enter the tags to record, and Recording conditions, where you say in which OB, how often, for how long and on what trigger. Compile it, go online, transfer it to the CPU, and it appears in the Installed traces table with an Active checkbox. Tick the box and the CPU is armed. From then on the laptop can go home; the recording runs in the CPU, and you read it back later into the curve diagram, save it into the project as a measurement, and export it as a .csv or a .ttrecx file if somebody else needs it. The manual’s quantity structure for the S7-1500 is at least four installed traces depending on the CPU, and 16 signals per trace configuration; the CPU 1516-3 PN/DP equipment manual makes that four traces of up to 512 KB each. The recording time is an OB, and the manual’s list is the program cycle OB1, time-of-day interrupts OB1x, time-delay interrupts OB2x, cyclic interrupts OB3x, synchronous cycle OB6x except OB60, and on the S7-1500 the MC-Servo OB91 and MC-Interpolator OB92. And it adds the sentence that decides where the sample sits: the measured values are recorded at the end of the OB, after the processing of the user program. So a trace in OB1 sees what the logic left behind at the end of each pass, not what the inputs looked like at the start of it. For a photo-eye that is fine, because the process image input was read before the pass and the trace records the image. For a bit that the program sets and clears within one pass it is not fine, because at the end of the pass it is always clear, and the trace will swear it never moved.
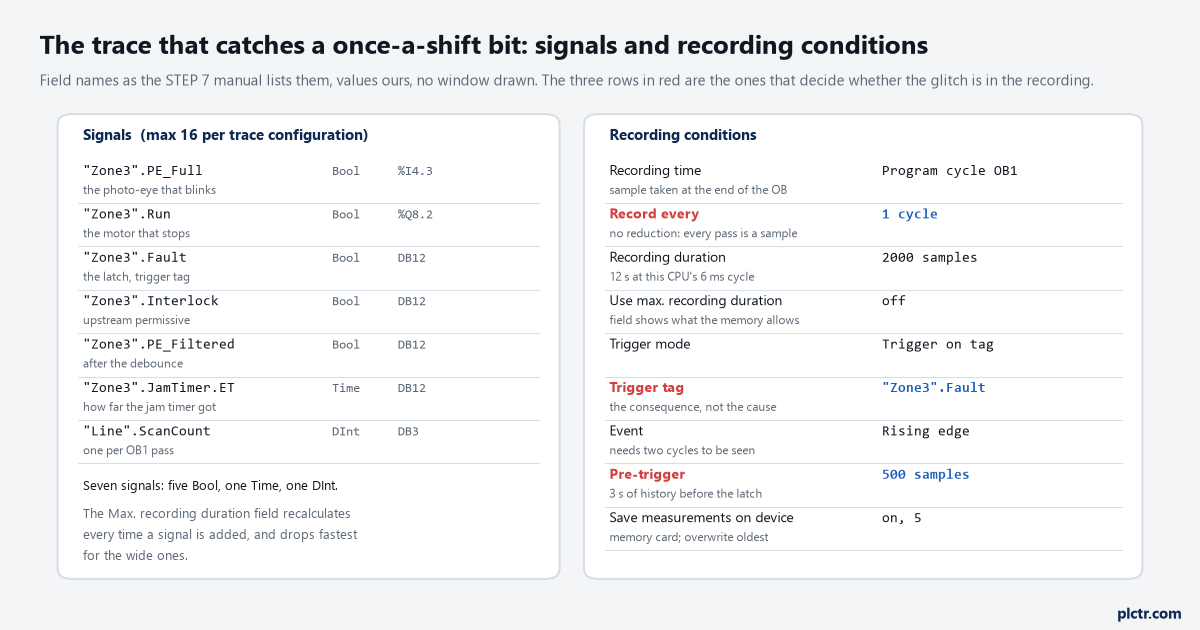
Field names as the manual lists them, values ours, no window drawn. Record every, the trigger tag and the pre-trigger are the three rows that decide the hunt.
Record the thing that latches from the bit as well, not only the bit.
Record every: leave it at 1
The reduction factor is the field called Record every, in cycles, or in seconds for OBs with a constant cycle time. It exists because memory is finite and a slow drift does not need a sample every 6 ms. On an intermittent bit it is the single fastest way to make the trace useless. Set it to 10 and the CPU takes a sample at the end of every tenth pass; a photo-eye that was low for one pass out of those ten is between two samples, and the recording shows a steady 1 across the moment the zone faulted. That is not a fault in the trace. It is arithmetic. The manual does say one useful thing about how the trigger behaves under a reduction: the trigger condition is checked in every cycle irrespective of the setting in Record every, and to reliably identify the trigger the trigger signal must be present for at least one full cycle. So a reduced trace still fires at the right moment; it just has nothing useful recorded around it.
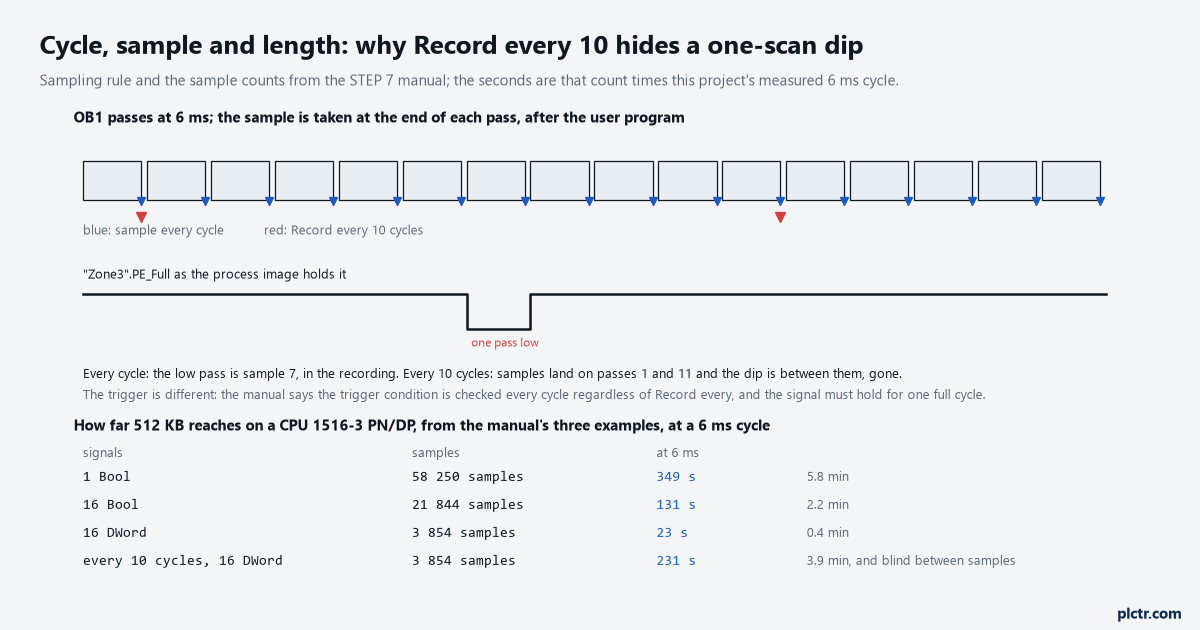
Sampling rule and sample counts from the manual; the seconds are those counts times this CPU’s 6 ms cycle.
Record every 1, always; when the recording is too short, drop signals instead.
Trigger on the consequence, and buy the history with the pre-trigger
The instinct is to trigger on the photo-eye going low. Do not. The photo-eye going low is the thing you are trying to prove happens, and triggering on it tells you it happened without telling you what the rest of the machine was doing when it did. Trigger on the latch instead: "Zone3".Fault, rising edge. The manual’s trigger events for a Bool are =TRUE, =FALSE, rising edge and falling edge, and for integers and floats rising signal, falling signal, in the range, outside of the range, = value and <> value. Two notes on the edge events matter: after activation of the installed trace at least two cycles are required to identify an edge, and the trigger signal has to hold for a full cycle to be seen. A one-scan pulse on a latched fault bit is not a problem; a one-scan pulse on the photo-eye itself, used as the trigger, can be. Then the pre-trigger, which is the field that turns a recording of an effect into a recording of its cause. Pre-trigger is the number of samples already recorded before the trigger condition is fulfilled, and the manual’s own example is a recording duration of 20 samples with a pre-trigger of 5: trigger 50 samples after activation and you get 20 samples, 5 of them before the event; trigger 2 samples after activation and you get 17, because the history was not there yet. On zone 3 that meant 2000 samples with a pre-trigger of 500, three seconds before the latch and nine after, and what the recording showed once it was armed properly was a single-sample dip on %I4.3 about 420 ms before the fault, followed one pass later by the interlock dropping and one pass after that by the run output, and the jam timer’s ET already up near its preset because an earlier, legitimate gap had started it. The photo-eye was not faulty. A polarised retroreflective eye on a zone with shiny shrink-wrap was getting a reflection off the film for one pass, and the debounce that should have swallowed it had been set to 0 ms during a commissioning hurry. None of that was findable from a watch table, and all of it was in one 12-second recording.
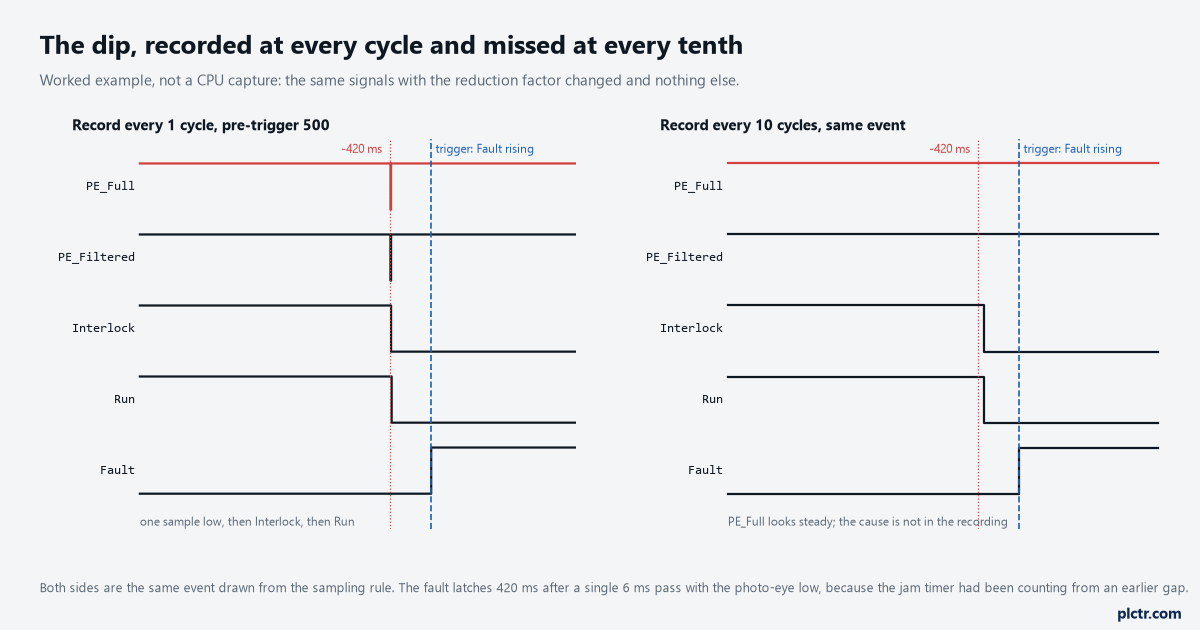
Worked example from the sampling rule, not a CPU capture. The photo-eye dips for one 6 ms pass 420 ms before the latch, the interlock drops the pass after, the motor the pass after that.
The eye was fine; the debounce was 0 ms; the recording said so in twelve seconds.
Recording length is memory, not time
The field is Recording duration, in samples or in seconds, and next to it is Max. recording duration, which the CPU recalculates every time you add a signal, because what limits a trace is bytes, not seconds. The manual’s three examples for a CPU 1516-3 PN/DP are the whole story: 3854 samples for 16 signals of the DWORD type, 21844 samples for 16 BOOL signals, and 58250 samples for a single BOOL. At a 6 ms cycle that is 23 seconds, 131 seconds and just under six minutes. So a trace of 16 double words reaches back 23 s at full rate, and the temptation is to reach further by setting Record every to 10, which buys 231 s of reach and blindness between every pair of samples. The better trade is fewer signals and narrower ones: the seven on zone 3 are five Bools, a Time and a DInt, and the maximum duration field comfortably covers the 2000 samples asked for. Tick Use max. recording duration and the CPU fills whatever the signals leave, which is the right setting when you do not know how far back the cause is.
There is a cost on the CPU side, and the manual names it: a trace recording increases the runtime of the recording level, and with high utilisation that can produce an execution level overflow. Its remedy is fewer tags, added back step by step, or a slower level. On a 6 ms machine with 16 signals in OB1 I have not seen it bite; in a 1 ms OB30 with the same 16 it will.
Arming it for a shift, and what survives the night
An intermittent fault is a waiting game, and the manual’s notes on the lifetime of an installed trace decide how you wait. Installed trace configurations are retained after POWER OFF, and the recording is activated again after the restart of the CPU. Recorded values, however, are lost during the restart. So an armed trace survives the night shift’s power cycle and re-arms itself, and whatever it had caught before the power went is gone. The answer to that is the option a little further down the same page: Save measurements on device, memory card, with a Number of measurements and a behaviour for when the number is reached. Tick it, set five, choose overwrite, and each triggered recording is written to the card and the trace re-arms, so in the morning there are up to five events to read rather than one or none. Two notes go with it. No new trigger can be evaluated as long as a recording is being saved, and the memory on the card is partly reserved for system functions, so the whole card is not available. Two more of the manual’s notes are the ones that cost people a night’s data. After downloading a configuration to the device in STOP, you must check the installed traces and, if required, reactivate them or transfer them again. And if signals or trigger tags that affect the address are changed, which it gives as a data block being shortened or extended or a type being changed, the trace configuration must be transferred to the device again. Somebody adds a tag to DB12 at four in the afternoon, downloads, and the trace that was watching DB12 is watching the wrong bytes or nothing until it is transferred again.
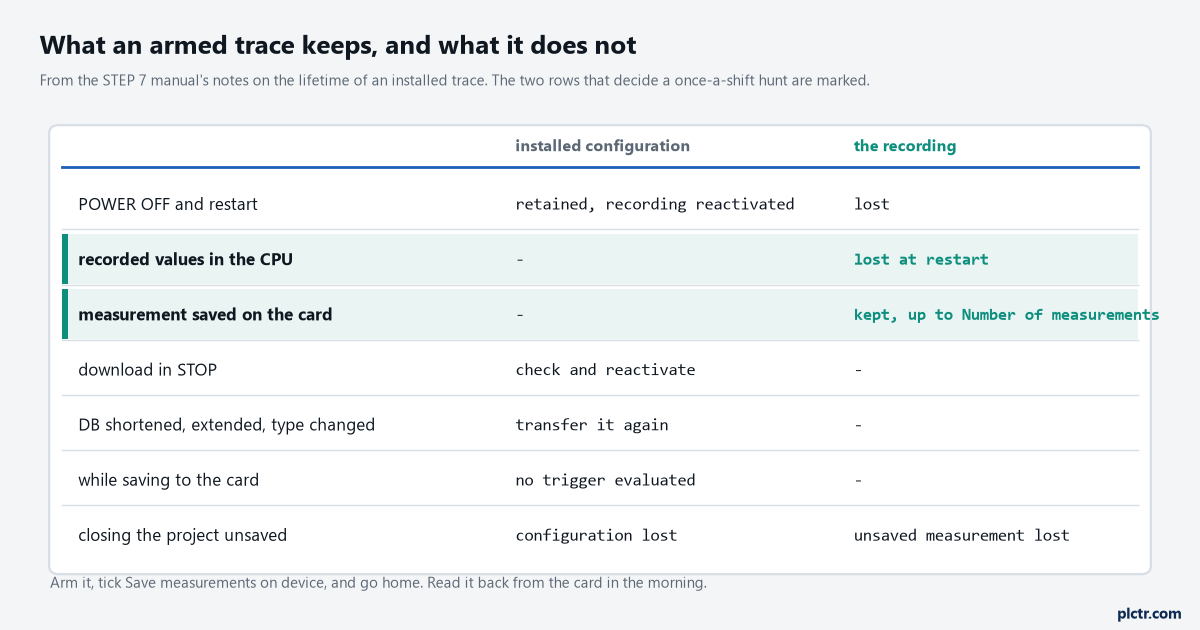
From the manual’s notes on the lifetime of an installed trace. Arm it, tick the card, go home.
Check the Installed traces table after every download, not only after your own.
The S7-1200 does the same job on a smaller scale, and its system manual is explicit about the numbers: two trace jobs, 16 variables each, 524288 bytes of RAM per job, measurements saved only to a SIMATIC memory card with 1 MB of external load memory always kept free, up to 999 saved measurements, and a warning that overwriting the oldest recording continually can reduce the lifetime of the card.
Before the trace: what everybody tries first
A faster OB. The reasoning is that a 6 ms sample is too coarse for a glitch, so the trace goes into OB30 at 1 ms. On a bit that comes from the process image that gains nothing: the input image is refreshed once per cycle, so a 1 ms trace records the same image six times over and the dip still occupies exactly one OB1 pass of it, unless a process image partition for that module has been assigned to the fast OB. Then a watch table with a trigger set to permanent, which shows the value at the moment the CPU answers and nothing in between. Then forcing the photo-eye to 1 to “rule it out”, which rules out the evidence.
Arm the trace, record every cycle, trigger on the latch, buy three seconds of history, save to the card.
Then go and read the diagnostics buffer as well, because a CPU that noticed something at the same timestamp will have written it there, and reading a buffer entry properly is its own skill. When the recording shows a photo-eye that really is blinking, the next page is where the eye sits in the zone and what a long box does to it. And if you are earlier in the job than this, with a value that will not update rather than one that flickers, the watch table page is where to start instead.