A SCADA client on the TR-14 line subscribes to 1180 tags in one group at 250 ms, which people write down as 4720 value updates a second. Over an hour the server actually delivered 3,832,580 notifications, and 3,744,000 of those came from 260 analogue tags, most of which were sitting still. The 920 digital and integer tags on the same line, doing all the actual work of the machine, accounted for 88,580 between them.
That ratio is the whole subject. An OPC scan rate costs you reads of the controller; a deadband costs you nothing at the controller and removes almost everything from the client. They are two different economies and nearly every argument about OPC performance is people talking about one while measuring the other.
The other half of the answer is less comfortable. A percent deadband is a percentage of the engineering range, not of the value, and on two of the four analogue tags below a perfectly ordinary 1% band silenced the signal completely for a whole hour.
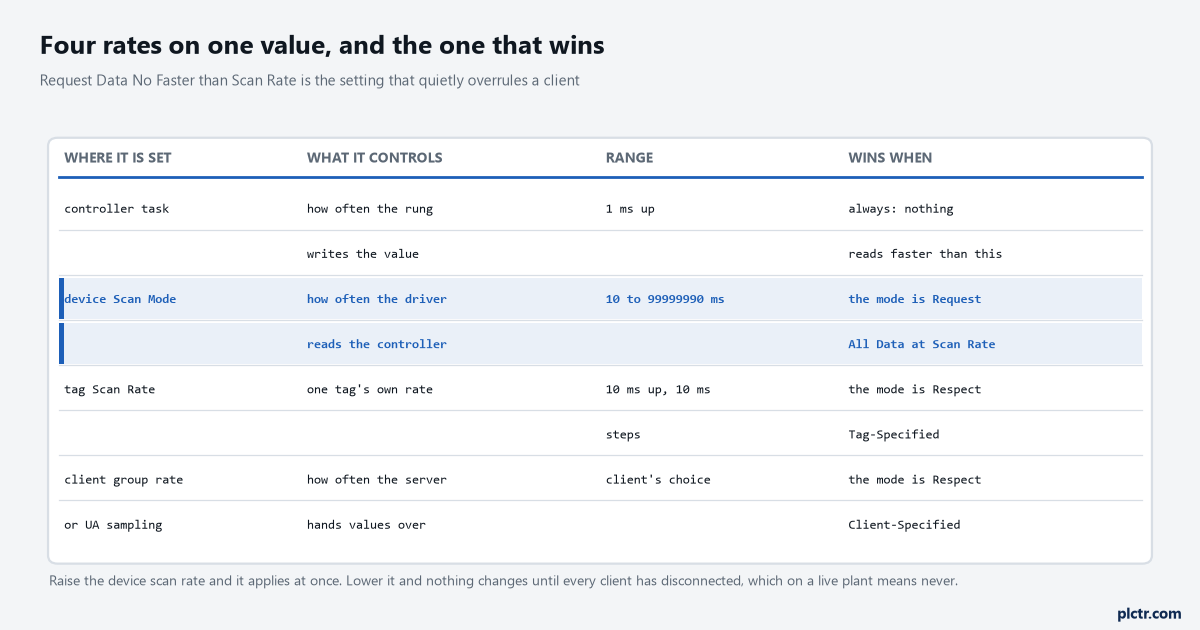
Four rates on one value. Request Data No Faster than Scan Rate is the one that overrules a client without telling it, and the note underneath is the asymmetry that catches everybody.
Four rates, and the one that wins
There are four numbers in play and they are set by four different people in four different pieces of software, which is why nobody can ever answer “how often is this read?” without opening three things.
On most sites nobody has permission to see all four of them at once.
The controller’s own rate is the floor. A tag written by a 100 ms periodic task changes at most ten times a second, and nothing downstream sees more than that however fast it asks.
The device Scan Mode in the server is where the argument is settled, and its five options are worth knowing by name rather than by position in a drop-down. Respect Client-Specified Scan Rate hands control to the client. Request Data No Faster than Scan Rate sets a ceiling: the client asks for 100 ms and gets whatever you typed, with a valid range of 10 to 99,999,990 ms and a default of 1000. Request All Data at Scan Rate forces the rate regardless. Do Not Scan, Demand Poll Only stops periodic polling entirely and will not even read an item’s initial value when it becomes active. Respect Tag-Specified Scan Rate pushes the decision down to each static tag’s own Scan Rate property, which has the same range in 10 ms steps and a default of 100 ms. Then there is the client. In classic OPC that is the group update rate; in OPC UA it is a sampling interval on each monitored item plus a publishing interval on the subscription, and the specification is clear that the sampling interval is a best-effort figure — servers support only a limited set of intervals, and where the exact one requested is not supported the server assigns the most appropriate one and returns it. That returned value is the revised sampling interval, and reading it is the only way to know what you actually got.
Now the trap, and it is genuinely nasty on a live plant.
The number you type is not always the number that gets applied.
Raise a device’s scan rate value and the change takes effect immediately. Lower it and the change does not take effect until every client application has disconnected. On a plant with a SCADA server, a historian and an engineering client all connected, that means never, and the engineer who lowered the number goes away believing it was applied.
Tags times rate is a ceiling, not a traffic figure
The 4720 updates a second in the first paragraph is arithmetic anybody can do and it is not what happens. Delivery is change-driven: an active item that experiences a change in value or in quality triggers a client update, at up to the group rate. A tag that does not change sends nothing at all.
Which splits the tag list into two populations that behave nothing like each other.
Digital tags are cheap because a machine is mostly idle between one event and the next.
The 920 digital and integer tags on TR-14 change when the machine does something. The 340 sequence-step bits change once per bag at 225 bags an hour, the 48 counters increment once per bag, and the 310 alarm and status bits are quiet unless something is wrong. Added up over an hour that is 88,580 notifications, which is 24 a second, which is nothing.
The 260 analogue tags are the problem, and the reason is noise.
Noise is not a defect here. It is simply what an analogue instrument does.
An analogue input is never still. A weigher reading through a 250 ms sample sees its own load-cell noise; a flow transmitter sees turbulence; a thermocouple sees the last digit walking. With no filter, every one of those samples is a change, so every analogue tag hits the group rate ceiling and holds it forever. Four times a second, 14,400 times an hour, per tag, whether the plant is running or on a weekend shutdown. Two hundred and sixty of them is 3,744,000 notifications an hour, and every one of them is written to a historian, evaluated by a scripted expression, and possibly forwarded across a link somebody is paying for by the megabyte.
That is what a deadband is for. Nothing else.
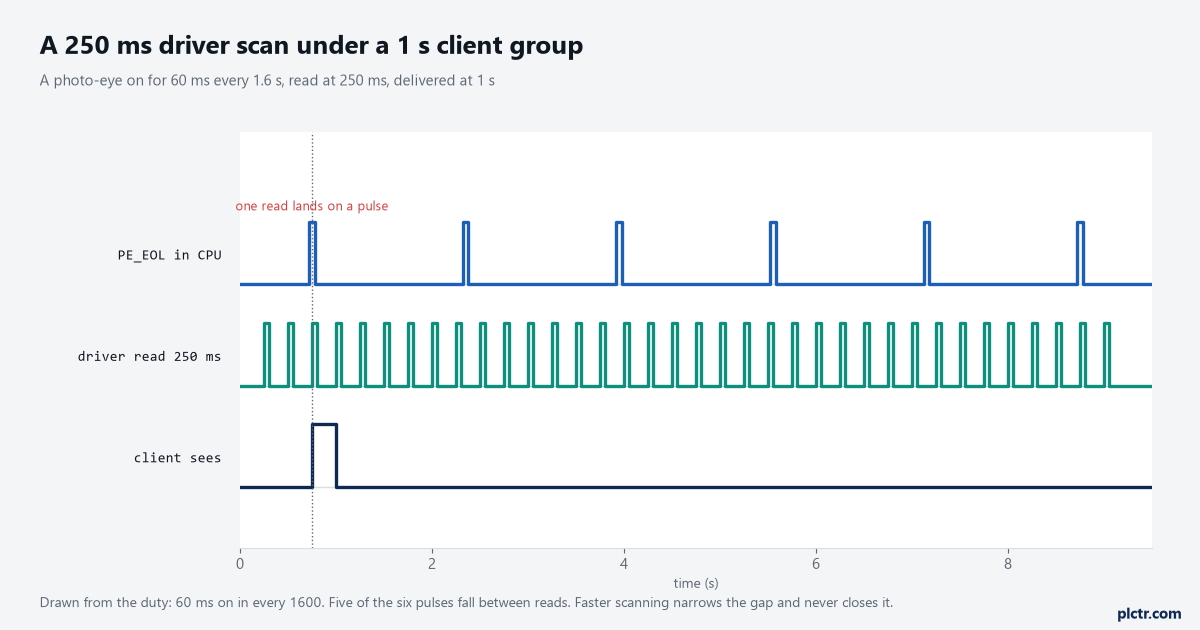
Scanning faster narrows the gap and never closes it. Five of these six pulses fall between reads, which is a sampling problem and not a fault to be chased.
What a percent deadband is a percentage of
This is the part that is wrong in most of what is written about it, and the specification is not ambiguous.
Part 4 defines the DataChangeFilter and the absolute case: generate a notification if the absolute value of the last cached value minus the current value is greater than the AbsoluteDeadband. The last cached value means the last value pushed to the queue, so it moves only when a notification is generated — not every sample. That detail is the entire behaviour and it is what makes a deadband work across a slow drift: a signal creeping by a thousandth of a unit per sample still reports, eventually, because the comparison is against the last value you were sent rather than against the last value the server read. Part 8 defines the percent case, and this is the sentence: for a PercentDeadband the value is defined as the percentage of the EURange, and it applies only to items with an EURange property that defines the typical value range. The range is multiplied by the deadband value and compared to the actual change. Not a percentage of the reading. A percentage of the span between the low and the high of the scaling somebody typed in years ago, and if there is no EURange at all the server rejects the filter with Bad_DeadbandFilterInvalid. The arrays case is worth knowing while you are in there, because it surprises people who subscribe to a whole array as one item: the deadband is evaluated per element, and as soon as any one element passes it the entire array is returned.
Read the EURange before you type a percentage anywhere. Every single time.
Take four real signals off the line and apply the same 1% to all of them.
Weigher_Wt is scaled 0.0 to 50.0 kg, so 1% is 0.50 kg. Line_Speed is 0.0 to 120.0 m/min, so 1% is 1.20 m/min. Seal_Temp is 0.0 to 250.0 °C, so 1% is 2.50 °C. Vac_Pressure is -100.0 to 0.0 kPa, so 1% is 1.00 kPa.
One number, four completely different filters, because the four ranges have nothing to do with each other.
Sample all four at 250 ms for an hour and count. With no deadband each of them produces 14,400 notifications, which is the ceiling, exactly as predicted. With 1% applied: Weigher_Wt drops to 9545, Vac_Pressure to 1715, and Line_Speed and Seal_Temp each send one. Not one a minute. One, in the whole hour, and that one is the initial value on subscribe.
One notification in an hour is not filtering. That is deletion with extra steps.
Line_Speed runs at 74 m/min and wanders by a third of a m/min. Seal_Temp sits at 182 °C and swings 1.8 °C either side across its control cycle. Neither of them ever moves 1% of its range, so neither of them ever passes the filter, and a client watching either one sees a plausible number with Good quality that has not changed since the shift before. That is a fault you have configured deliberately, and it is the subject of the next article in this batch.
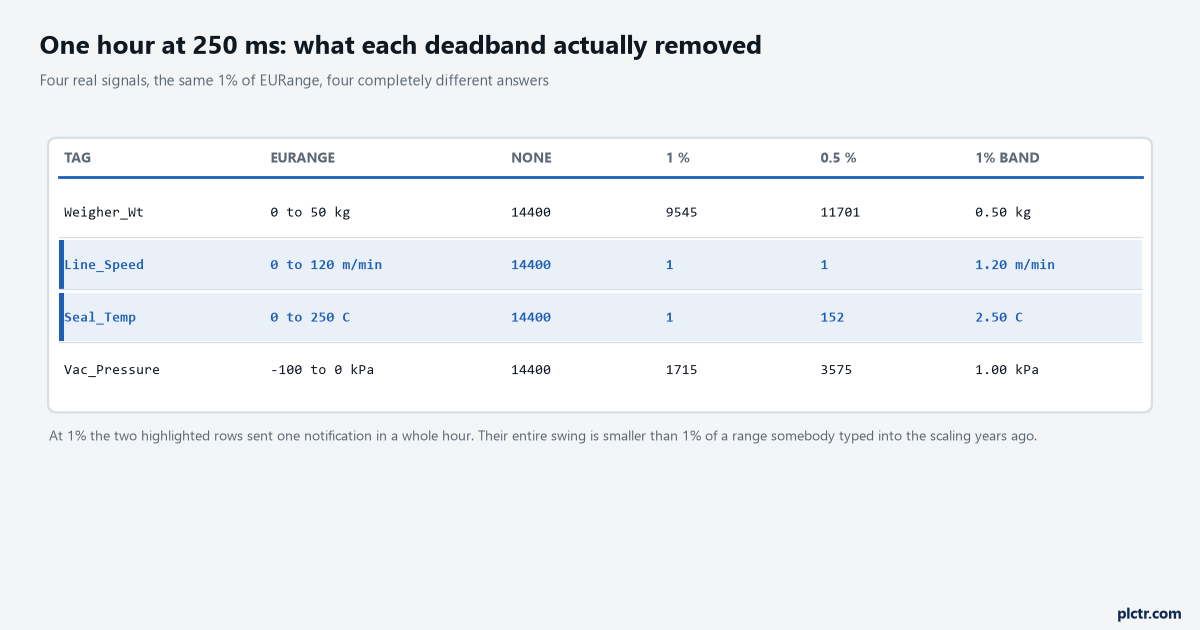
The same 1% of range against four signals. The highlighted pair sent one notification in an hour, because their entire working swing is smaller than 1% of a range nobody looked at.
The weigher, where a deadband does almost nothing
Weigher_Wt is the interesting one, because it is the tag you would expect a deadband to help most and it barely moves.
The bagging cycle fills 25.0 kg in 12 seconds. That is 2.083 kg per second, which is 0.5208 kg in one 250 ms sample — larger than the 0.50 kg band. So during the fill, almost every sample passes the filter anyway, and the only thing holding the count down to 9545 instead of 14,400 is the load-cell noise pushing individual differences either side of the threshold. Tighten the band from 0.50 kg to 0.25 kg and the count goes to 11,701. Tighten it further to 0.10 kg and it stays at 11,701, exactly, because this signal has no changes of that size to filter — it either steps 0.52 kg on the ramp or it jiggles by 0.06 kg on the hold.
A deadband only removes what lies inside it. If your signal’s change distribution has nothing between the noise and the ramp, everything between those two numbers is a setting with no effect.
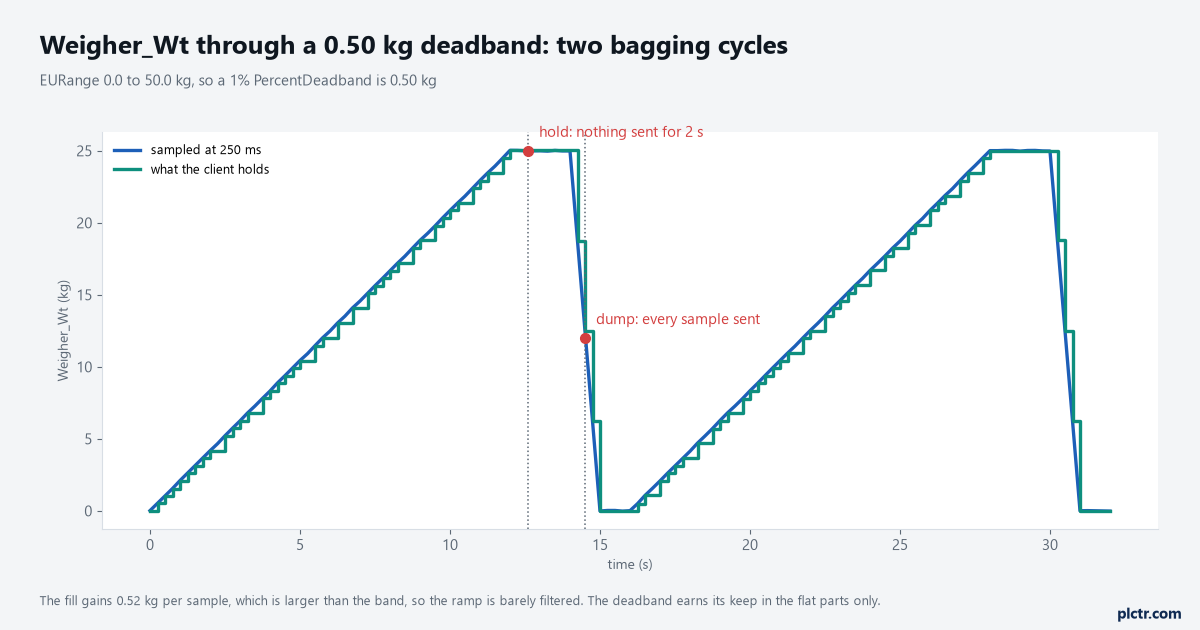
Drawn from the same cycle the counts come from. The client’s copy is a staircase, flat through the hold and matching the sample almost step for step through the fill, which is where the deadband earns nothing.
The rebuild, and the before and after
The fix is not a global percentage. It is a rate chosen from what the tag is for and a band chosen from the instrument’s own noise, which takes an afternoon and is worth it.
Three scan groups instead of one. That alone is most of the saving.
Split the 1180 tags into three groups. Two hundred tags that an operator watches or an interlock depends on stay at 250 ms. Five hundred and sixty go to 1 s. Four hundred and twenty — setpoints, recipe values, totals, anything a person reads once a shift — go to 10 s. On ceiling arithmetic alone that takes 4720 updates a second down to 1402, which is 70.3% off before a single deadband is set.
Then set the bands from the instruments rather than from the ranges. Weigher_Wt keeps 250 ms with a 0.10 kg band, which is 0.20% of its range. Line_Speed goes to 1 s with 0.40 m/min, which is 0.33%. Seal_Temp goes to 10 s with 0.25 °C, which is 0.10%. Vac_Pressure goes to 1 s with 1.00 kPa.
The result over the same hour: 967,575 notifications against 3,832,580, which is 74.8% removed with every signal still reporting.
Compare that with the blanket 1%, which came out at 820,610 and looks better. It is not better. It got there by deleting two of the four signals, and the 152,000-notification difference between the two columns is the price of Seal_Temp and Line_Speed still existing.
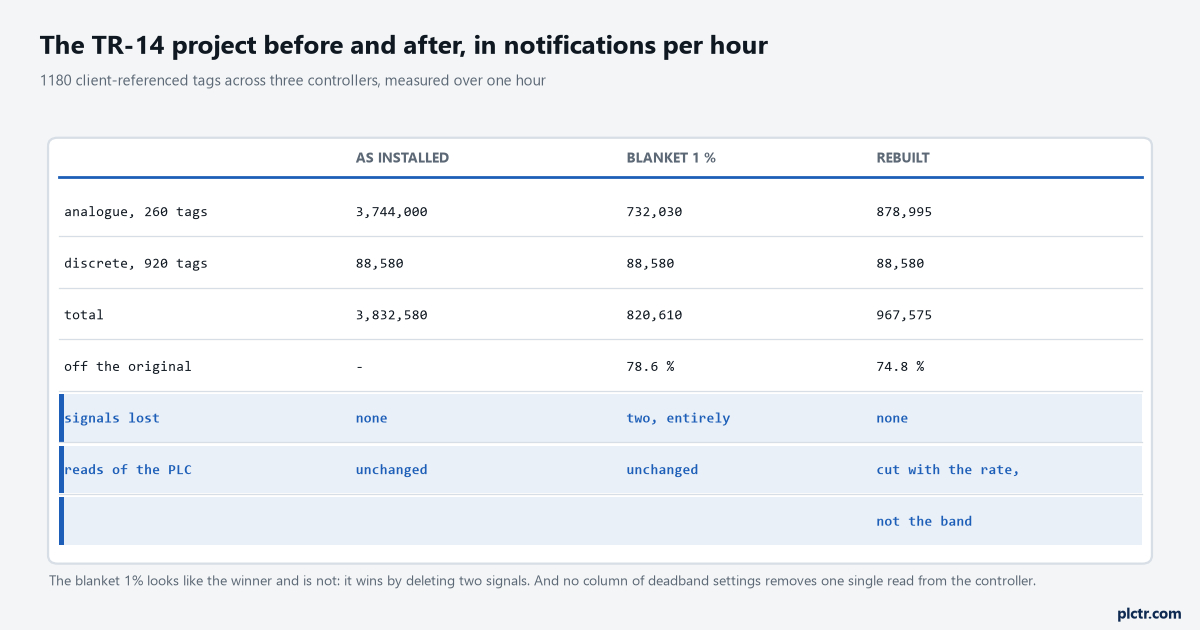
The bottom two rows are the ones to read. The blanket setting wins on volume by losing two signals, and no column here removes a single read from the controller.
What none of this does to the controller
Here is the part that catches people out, and it catches them out in the direction that costs money: a deadband is applied by the server to what it sends the client. It changes nothing about how often the server reads the PLC.
The controller never hears about your deadband settings at all.
The driver still asks the controller for Seal_Temp four times a second while sending the client nothing. The read traffic on the wire is identical. The connection load on the CPU is identical. If your complaint is that the controller’s scan time went up when the OPC server was commissioned, every deadband in the project is irrelevant to it and the only levers are the device Scan Mode, the tag Scan Rate, and moving tags off devices that are asked for them too often.
What those reads cost is measurable and it is documented on the Rockwell side rather than the OPC side. The system overhead time slice is the percentage of time the controller devotes to service communication, which is everything not configured in the I/O tree — the OPC server, the HMIs, the MSG instructions. At 10% the continuous task runs 9 ms and service communication gets up to 1 ms. At 20% it is 4 ms against 1 ms. From version 16 onward the slice is fixed at 1 ms at 50% and above, with multiple consecutive 1 ms intervals at the higher settings, so at 90% there are nine of them.
And the sentence people miss: if there is no continuous task, the overhead time slice has no effect at all. Periodic and event tasks are never interrupted by service communication, so the whole cost lands on the continuous task and on nothing else.
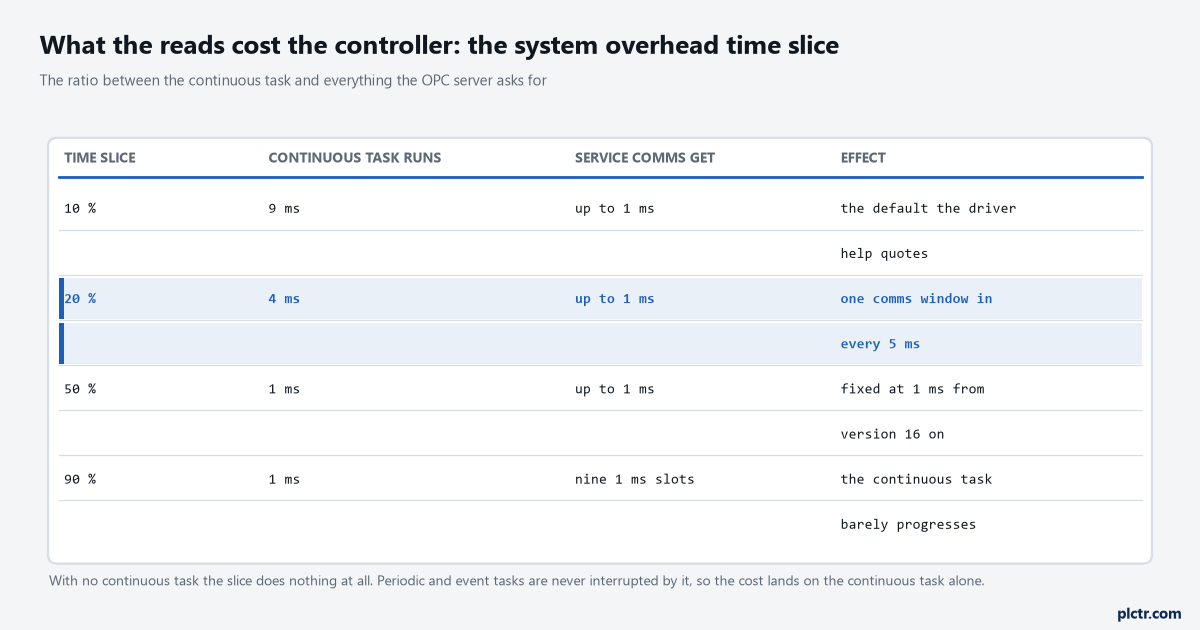
The ratio between the continuous task and everything the OPC server asks for. The row nobody reads is the last one: with no continuous task in the project, this setting does nothing.
Measure it rather than estimating it
Everything above is arithmetic and arithmetic is a starting point. The server will tell you the truth if you ask it, and the asking takes five minutes.
Ten minutes of counting beats an afternoon of arguing about what it might be.
Enable Diagnostics Capture on the channel. That adds a _Statistics branch under the channel in the browse space, and the tags in it are the ones that matter: _SuccessfulReads and _FailedReads as running counts, _RxBytes and _TxBytes for volume, _PendingReads for the queue right now, and _MaxPendingReads for the worst it has been since the counters were last cleared. Write a non-zero value to _Reset, wait a measured ten minutes, and read _SuccessfulReads. Divide by 600 and you have requests per second, which is the number you have been guessing at.
_MaxPendingReads is the one worth watching. A pending read queue that grows is a channel being asked for more than it can retire, and no amount of deadband tuning will touch it.
A pending read queue that keeps growing is the only honest capacity warning you get.
Turn diagnostics off again afterwards. The manual is straightforward that the feature carries overhead and recommends using it when needed and disabling it when not, and on a busy channel it is not free.
What to do on your own project this week
Pick one device, count the analogue tags on it, and multiply by the group rate to get the ceiling. Then reset the statistics, leave it ten minutes, and compare. The gap between those two numbers tells you whether you have a rate problem or a deadband problem, and they have different fixes.
If it is a deadband problem, get the EURange of each analogue tag in front of you before you type a percentage anywhere, because the percentage means nothing without it. If it is a rate problem, the first move is not lowering the device scan rate — remember that lowering it does nothing until every client disconnects — but splitting tags into groups that deserve different rates.
And if the value you are chasing is one that has stopped moving altogether, stop tuning and read the next article, because a band wider than the signal looks exactly like a dead controller. The path from the tag in the PLC to the client at the far end has four places it can stall and only one of them is a rate. If you are sizing storage rather than traffic, the sample rate and deadband arithmetic for a year of history is the same calculation pointed at a disk, and how much of the controller’s time you have left is the measurement to take before you ask it for anything more.