Good Quality, Stale Value: Diagnosing an OPC Link That Is Lying to You
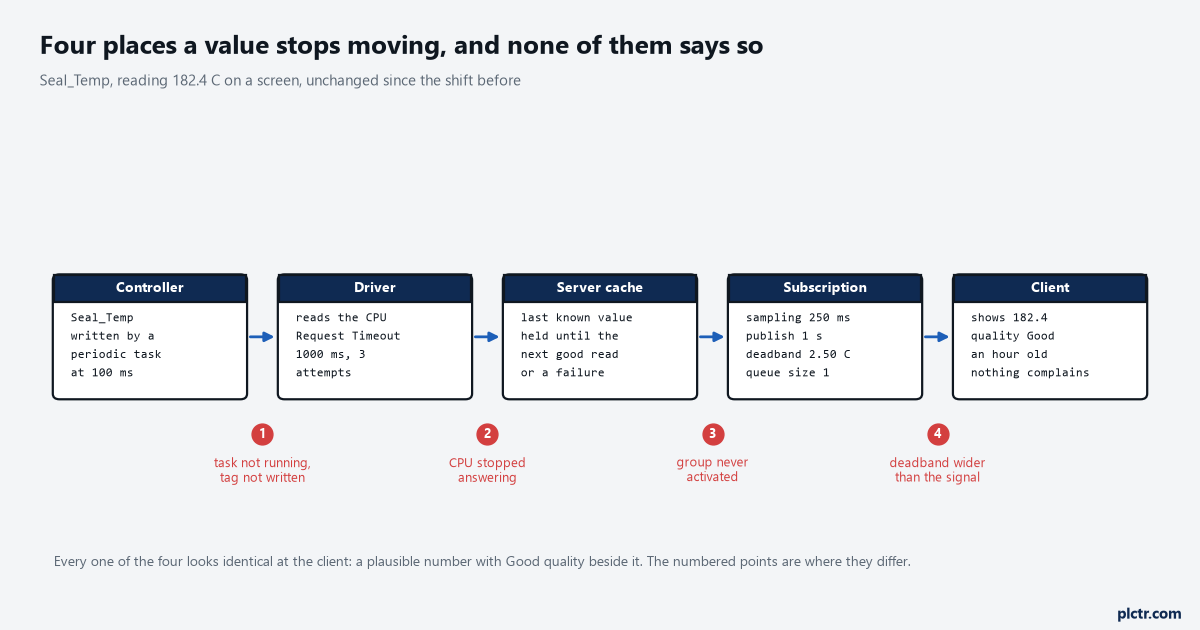
Five boxes in a row from the controller through the driver, the server cache and the subscription to the client, with four numbered red break points marked underneath

Seal_Temp has read 182.4 °C since about 04:00, the quality field next to it says Good, and the trend behind it is a flat line eleven hours long. The bagger has run four product changes in that time and the seal jaws are visibly hot. Nothing on the SCADA is in alarm, nothing in the … Read more
Scan Rates, Scan Groups and the Deadband That Halves Your Traffic

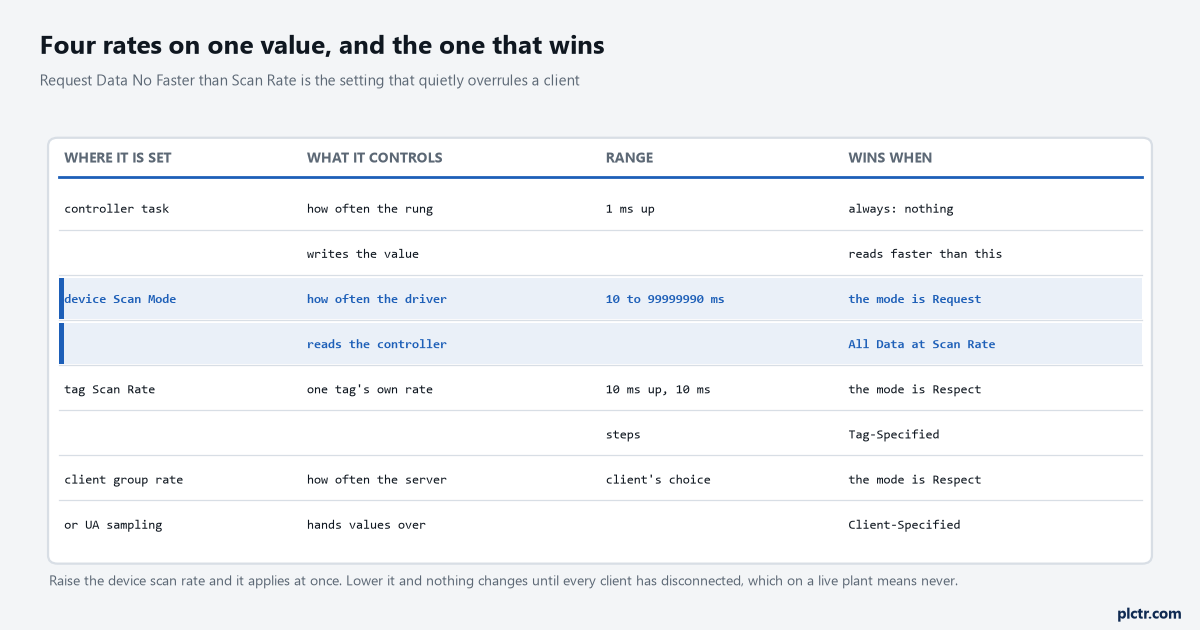
A four-column table listing the controller task, the device Scan Mode, the tag Scan Rate and the client group rate against what each controls, its range and when it wins, with the device Scan Mode rows highlighted

A SCADA client on the TR-14 line subscribes to 1180 tags in one group at 250 ms, which people write down as 4720 value updates a second. Over an hour the server actually delivered 3,832,580 notifications, and 3,744,000 of those came from 260 analogue tags, most of which were sitting still. The 920 digital and … Read more

Advertisement