Availability 86.0 percent, performance 90.0 percent, quality 99.0 percent, so OEE is 76.6 – and all three of those numbers are decided by a seven-state table in the controller rather than by the board that prints them. Blocked and starved each need three seconds of outfeed-full or infeed-empty before they count, and whichever sits higher in the priority order is the one that gets the blame. The PLC decides what counts as running, when a stop becomes downtime, which reason code is attached to it and which bottle was a reject. Get that order wrong and the Six Sigma team spends three months optimising a number that never described the line.
The example machine is a rotary filler on a bottling line, 300 bottles per minute nameplate, running on a 5069-L320ER in Studio 5000 v33 with a FactoryTalk View SE station and Ignition 8.1 as the historian and MES bridge. The same logic runs a stamping press or a case packer.
What you need before the first rung
| Item | Used here | Why it matters |
|---|---|---|
| Controller | CompactLogix 5069-L320ER, v33 | Periodic task at 100 ms for the state model, wall clock for timestamps |
| Count sensor | Turret encoder pulse per pocket plus a bottle-present sensor | One count per pocket that actually held a bottle |
| Reject confirmation | Photo eye after the reject pusher | Count rejects where they leave the line, not where they were judged |
| HMI | FactoryTalk View SE, reason code popup | Operator selection with a 60 s reminder |
| Historian and MES link | Ignition 8.1 Tag Historian, SQL Bridge transaction groups | Store state ticks, counts and the event FIFO |
| Definitions | ISO 22400-2 for OEE terms, ISA-95 for the shift and order context | So the plant and the corporate dashboard use the same arithmetic |
Write the state table first, with the priorities
Seven states cover most discrete machines. The table order is the priority order in the code, and that order is where most bad OEE numbers start.
| Code | State | Set by | Counts as |
|---|---|---|---|
| 0 | Not scheduled | HMI schedule bit, breaks and planned maintenance | Removed from planned time |
| 6 | Changeover | Recipe change active, from the HMI | Availability loss, SMED target |
| 4 | Fault | Any bit in the fault word | Availability loss, auto reason code |
| 5 | Operator stop | Auto mode off, no fault | Availability loss, operator reason code |
| 3 | Blocked | Outfeed full for more than 3 s | Availability loss, blamed downstream |
| 2 | Starved | Infeed empty for more than 3 s | Availability loss, blamed upstream |
| 1 | Running | Auto, no fault, not starved or blocked | Run time, short stops land in performance |
Two decisions in that table belong to the improvement team, not the software. First, changeover is an availability loss here, where the six big losses put it, not planned time. Hide it in planned time and the SMED work never shows on the board. Second, a stop shorter than 3 s is not a stop. It stays inside Running and the missing bottles appear as a performance loss. 3 s suits a filler that coasts for half a second; a press with a 12 s cycle would use two cycle times.
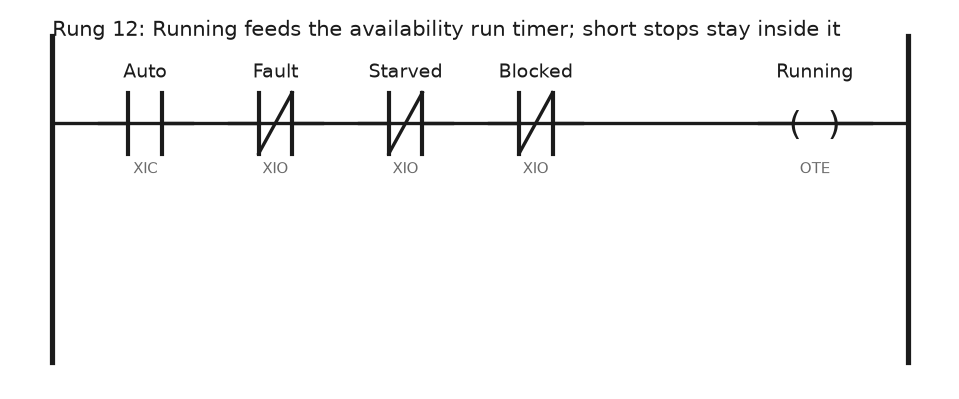
Rung 12 is the only rung on the machine that defines run time. Nothing on the HMI or in the MES gets to redefine it. The schedule bit and a changeover both drop Auto on this filler, so four contacts cover the seven states.
Track the state in one Structured Text routine
The state model lives in a 100 ms periodic task so every scan is one clean tick and the totals do not drift with the continuous task. Written for Logix ST, so the timers are TONR calls and the FIFO load is an FFL call.
(* Filler_State routine, 100 ms periodic task, Studio 5000 v33, 5069-L320ER *)
(* Clock_Now is a DINT[7] filled by a GSV WallClockTime LocalDateTime rung *)

Starved_Dly.PRE := 3000;                          (* 3 s micro-stop threshold *)
Starved_Dly.TimerEnable := Infeed_Empty AND Machine_Auto;
TONR(Starved_Dly);

Blocked_Dly.PRE := 3000;
Blocked_Dly.TimerEnable := Outfeed_Full AND Machine_Auto;
TONR(Blocked_Dly);

IF Not_Scheduled THEN
    Filler_State := 0;
ELSIF Changeover_Active THEN
    Filler_State := 6;
ELSIF Fault_Word <> 0 THEN
    Filler_State := 4;
ELSIF NOT Machine_Auto THEN
    Filler_State := 5;
ELSIF Blocked_Dly.DN THEN
    Filler_State := 3;
ELSIF Starved_Dly.DN THEN
    Filler_State := 2;
ELSE
    Filler_State := 1;
END_IF;

(* 100 ms ticks per state for the shift, DINT; the MES divides by 10 *)
OEE.StateTicks[Filler_State] := OEE.StateTicks[Filler_State] + 1;

(* one event per transition into the FIFO the MES drains *)
IF Filler_State <> Filler_State_Last THEN
    Event.Seq    := Event.Seq + 1;
    Event.State  := Filler_State;
    Event.Reason := Auto_Reason;                  (* 0 until the operator or the fault map fills it *)
    Event.Count  := OEE.TotalCount;
    COP(Clock_Now[0], Event.Stamp[0], 7);
    Event_Ctl.EN := 0;                            (* no rung edge in ST; clear EN so this call loads *)
    FFL(Event, Event_FIFO[0], Event_Ctl, 64, Event_Pos);
END_IF;
Filler_State_Last := Filler_State;
The FIFO is the handshake. The PLC never writes straight into a database; it appends to Event_FIFO, Ignition reads the head, writes the row and hands back Event_Seq_Ack. A rung after this routine unloads the FIFO only when the acknowledged sequence matches the head. If the network drops for twenty minutes the events queue up and nothing is lost. The FFL mechanics are in PLC FIFO usage with FFL.
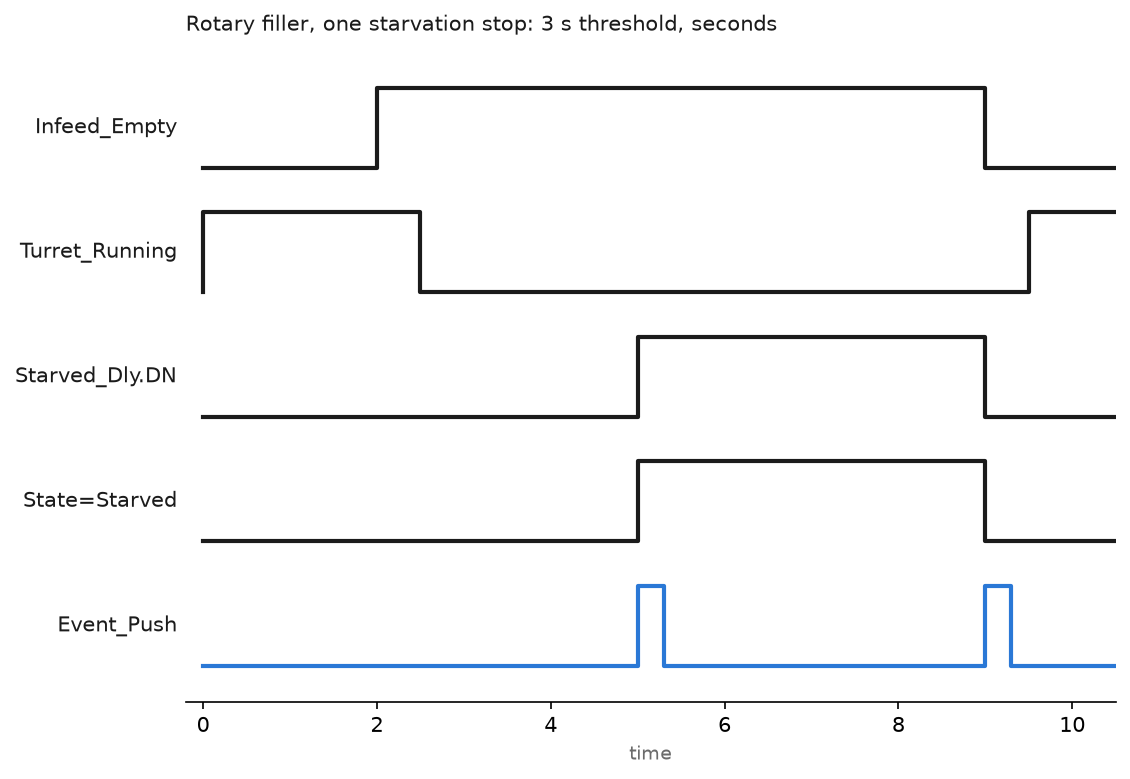
Read the chart against the arithmetic. The infeed empties at 2 s, the turret stops on the low-level sensor at 2.5 s, and the state only changes at 5 s when the delay expires. The 2.5 s between turret stop and state change stays in Running and shows up as lost bottles in performance. The 4 s from 5 s to 9 s is availability loss blamed upstream, with no operator input.
Attach a reason to every stop
Fault stops get their reason from a map, not from a person. A small lookup routine turns the lowest set bit of Fault_Word into a code from a table the maintenance team owns. On this filler the ranges are 100 to 199 mechanical, 200 to 299 electrical, 300 to 399 material and 400 to 499 quality. Bit 3, capper torque fault, becomes code 214. That code goes into Auto_Reason
Operator stops are the hard part. When the state has been 5 for 60 s and Event.Reason is still 0, the HMI opens a popup with the reason list and a timer. The operator picks one; the PLC writes it into the open event with a second FFL entry, same sequence number, reason filled. If nobody picks, the event closes with 999, unassigned, and the Pareto chart shows an ugly 999 bar. Leave that bar visible; defaulting it to “other” hides that operators are not being asked at the right time.
Andon comes for free once the state is right: stack light, line display and supervisor text all key off Filler_State, and the escalation timer runs off the same event timestamp. HMI side: introduction to HMI in PLC systems.
Compute OEE from the numbers the PLC already has
- Planned production time. Shift of 480 min minus the time in state 0, 30 min on this shift, gives 450 min.
- Run time. Add states 2 to 6: 63 min of downtime, so run time is 387 min. Availability is 387 divided by 450, 86.0 percent.
- Performance.
OEE.TotalCountcame from the pocket encoder and the bottle-present sensor, 104,490 bottles. Ideal output is 387 min times 300 per minute, 116,100. Performance is 90.0 percent. - Quality. Rejects counted at the pusher confirmation eye, 1,045. Good count 103,445, quality 99.0 percent.
- OEE is 0.860 times 0.900 times 0.990, 76.6 percent.
Do the sums in the MES, not in the PLC; the ratio belongs where the shift calendar and the order live. ISO 22400-2 defines availability, effectiveness and quality ratio in these terms, so cite it when corporate asks why your 76.6 disagrees with their dashboard.
Cycle time on a press follows the same pattern. Stamp the wall clock on each cycle start, subtract the previous one, and drop the result into one of 20 bins, 100 ms wide, either side of the nominal cycle in a DINT array. The HMI draws the histogram from the array, no data logger needed. A bimodal histogram usually means two operators with two habits, which no averaged cycle time will ever show.
SPC sample triggers work the same way. Every 5,000th bottle, or every 30 min in the shift, the PLC raises Sample_Due, the operator weighs five bottles, and the values go into the MES against the order. With a checkweigher on the line, the PLC copies the last five net weights into a sample record and pushes it through the same FIFO.
Structure the tags so the historian can read them
One UDT per machine, OEE_Machine, holds State, StateTicks[8], TotalCount, RejectCount, ReasonCode, Shift, OrderNo and a Heartbeat the historian trends to prove the link is alive. The MES writes Shift and OrderNo down; the PLC writes everything else up. Ignition’s Logix driver reads the UDT directly, the Tag Historian logs the counters on change, and a SQL Bridge transaction group, triggered while Event_Pos
Field notes
Rejects counted twice. A line reported 3.1 percent rejects for a year. The vision system counted a bottle when it flagged a low fill, and the checkweigher counted the same bottle again when it confirmed the low weight. Moving the count to the pusher confirmation eye dropped quality loss to 1.6 percent overnight.
Blocked stops blamed on the filler. The original program had no blocked state; if the turret was not turning and there was no fault, it was an operator stop. The palletiser was backing up the line for 40 min a shift and the filler carried the blame on every Pareto. Adding state 3 with the outfeed full sensor moved the top bar to the right machine.
Micro-stops with no threshold. A stamping press logged a stop every time the operator touched the two-hand control late, 400 events a shift of 1 to 2 s each. A threshold of two cycle times, 24 s on that press, cut the events to 30 a shift and the same lost time appeared in the performance figure where it belonged.
Frequently asked questions
Should the PLC calculate OEE itself?
Keep counts and seconds in the PLC and do the ratios in the MES. The shift calendar, the order and the planned time live there, and changing a planned break should never mean a controller download.
How do I pick the micro-stop threshold?
Start with two cycle times for cyclic machines and a few seconds for continuous ones, then look at the event histogram after a week. If most events sit just above the threshold, it is too low.
Do I need a historian, or is a CSV enough?
A CSV on the HMI proves the concept for one machine. Once three machines feed one board you need one clock and a database that joins events to orders.
Next step
Build the UDT before the routine; the layout in user defined datatype usage examples fits the OEE_Machine structure above. Then copy the state routine to the second machine and change only the state inputs, so the line board compares like with like. Where those machines are stations on one line and the blame has to land on the station that actually stopped, the structure is in assembly line station logic.