Belt1_Current crossed 30 A at 11:42:13.412 UTC. The OPC UA server stamped that value 11:42:13.592, the gateway published it at 11:42:13.637, and the row reached the table at 11:42:14.297. One event, four times, 885 ms apart on a day when nothing at all was wrong.
Store the second one. The OPC UA SourceTimestamp is the record, it goes in an indexed column, and the arrival time goes in a second column beside it so that arrival minus source is a number you can plot. The other two are diagnostics about delivery and neither of them belongs on the time axis of a trend.
That is the answer. What makes it worth 2000 words is the day the gateway comes back from an outage and hands you an hour of old data with fresh arrival stamps on it.
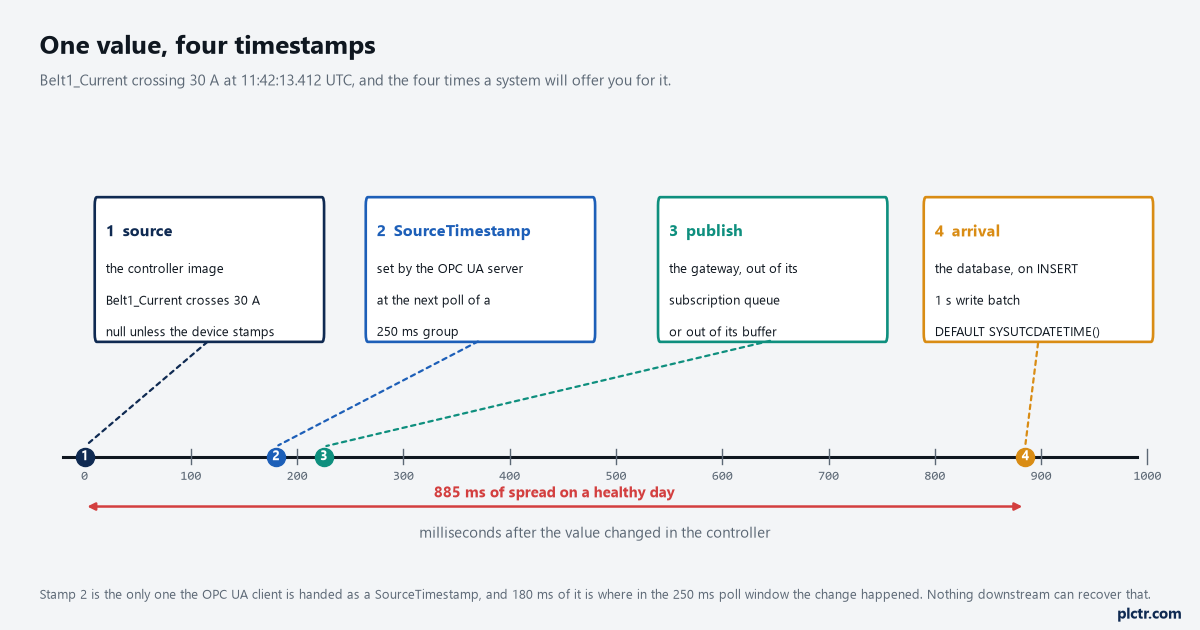
Four stamps, one value, and not one of them is wrong. They are answers to four different questions, and the trouble starts when a system stores whichever one it happened to be holding.
What each of the four actually is
Only one of them claims to be the time the value was true, and OPC UA is explicit about which.
Part 4 of the specification defines a DataValue as the value, a status code, a source timestamp with a picosecond extension, and a server timestamp with the same. The SourceTimestamp is described as the timestamp applied to a variable value by the data source, and the specification’s constraints on it are the useful part. It shall be UTC. It should indicate the time of the last change of the value or the status code. Once a value has been assigned a source timestamp, that timestamp for that value instance never changes — so when one UA server subscribes to another, the receiving server shall pass the source timestamp through without touching it. It should be generated as close as possible to the source, but the specification adds a condition that matters more than the first half of that sentence: the timestamp needs to be set always by the same physical clock, and where sources are redundant, their clocks should be synchronized. And if the source that applies the timestamp is not available, the source timestamp is set to null rather than filled in with something plausible. Most controllers do not apply one. A CompactLogix has a wall clock but does not stamp individual tag values with it, so for a polled tag the OPC UA server is the source, the SourceTimestamp is the server’s clock at the moment of the poll, and the 180 ms in the figure above is simply where in a 250 ms polling window the change happened to fall. Nothing downstream can recover that, which is the first honest limit to accept.
The ServerTimestamp is the one people misread.
Part 4 defines it as the time the server received the value or knew it to be accurate, and the second clause is not a footnote. The specification’s own example: a server subscribed to a value every ten seconds gets nothing when the value does not change, because not receiving a value means the value has not changed — so in the absence of errors it applies a new ServerTimestamp every ten seconds anyway. A second example makes it sharper. An exception-based device checked every 0.5 seconds last sent 1.234 three minutes ago; the server’s value is still 1.234, and its ServerTimestamp has been updated every 0.5 seconds since. So a ServerTimestamp of three seconds ago does not mean the value changed three seconds ago. It means the server still believes it. That is exactly what you want in a “is this data fresh?” column and exactly what you do not want on a trend’s x-axis, and a connector that writes whichever timestamp it was given into a column called timestamp will happily give you the wrong one.
The third and fourth stamps are not in the DataValue at all. The gateway’s publish time is when a row left the buffer, and the arrival time is when the database wrote it.
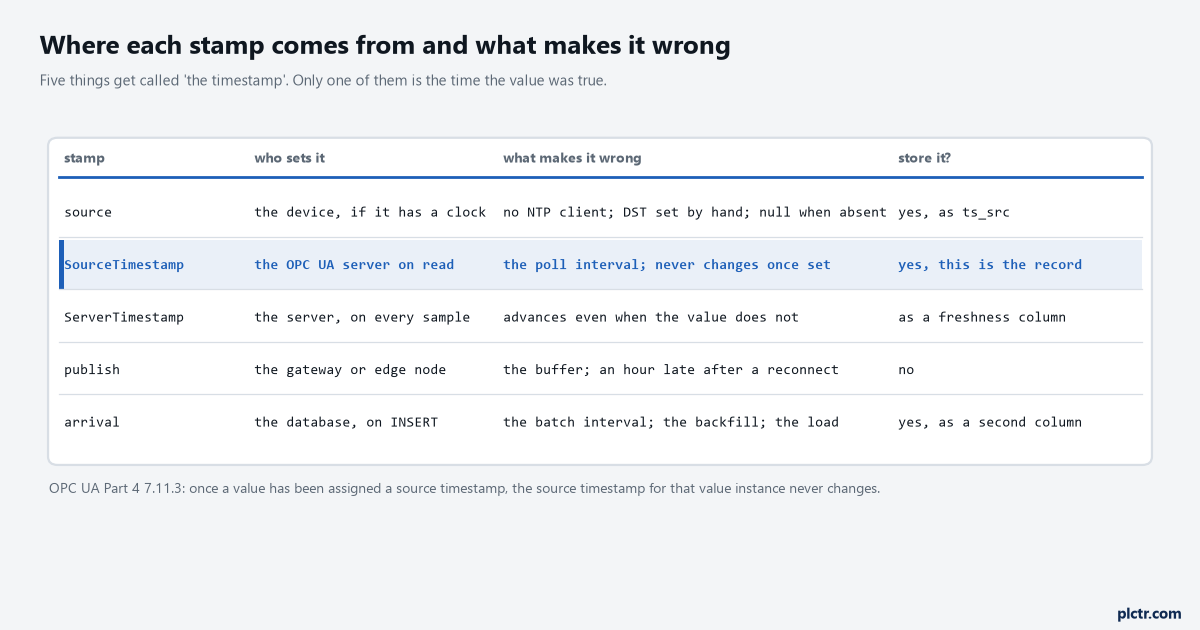
The highlighted row is the record. The two below it are worth a column each; the publish time is worth nothing once the row has landed.
How far apart they get on a healthy day
885 milliseconds, and nearly a third of it is not recoverable by anything.
The breakdown in the figure is a normal path: 180 ms because the change fell somewhere inside a 250 ms polling group, 45 ms for the publish out of the subscription, 12 ms across the broker, 8 ms of network to the DMZ, and 640 ms of waiting for the gateway’s one-second write batch to close. The two big terms are both quantisation rather than latency. A 250 ms poll contributes anything from 0 to 250 ms with a mean of 125, and no amount of clock synchronisation anywhere on the path recovers where inside that window the value moved. A one-second write batch does the same again, an order of magnitude larger. So if you need an event timed better than a quarter of a second, the polling group is the thing to change and the database is not.
Two settings on the OPC UA side decide how much of this you even see. Part 4’s TimestampsToReturn enumeration is SOURCE, SERVER, BOTH or NEITHER, and the answer is BOTH — a client that asks for SOURCE only has thrown away its freshness diagnostic before it has one. The other is queueSize on the monitored item, which defaults to 1, and a queue size of 1 means no queuing at all: between two publishes, only the most recent value survives and the earlier changes are silently gone. Raise it above 1 and you get the Overflow bit, InfoBits bit 7 of the status code, which is set only when the queue size is greater than one and tells you the server had to discard. A value arriving with that bit set is the server saying it dropped changes you asked for, and most clients never look at it. The Python OPC UA client article covers opening the session these settings live on.
What happens when a buffered gateway reconnects
This is the part that turns a design detail into an incident report, and it is entirely predictable.
A gateway reading 20 values a second loses its uplink for 62 minutes. It does what it is supposed to do — queues 74,400 values on its own disk, with each value carrying the SourceTimestamp it was given at the moment it was read. The link comes back and the queue drains at 900 rows a second, so all 74,400 rows are written in 83 seconds. Now look at the same table two ways. Keyed on the SourceTimestamp, the hour looks exactly like every other hour: 20 values a second, continuous, nothing missing. Keyed on the arrival time — which is what DEFAULT SYSUTCDATETIME()
ts_src and not ts_ins, and it is also the argument for keeping ts_ins at all: the difference between them is the delivery delay, it is normally under a second, and a plot of it over a month is the best network monitor you will get for eight bytes a row. The SQLite queue article stores exactly this pair for exactly this reason.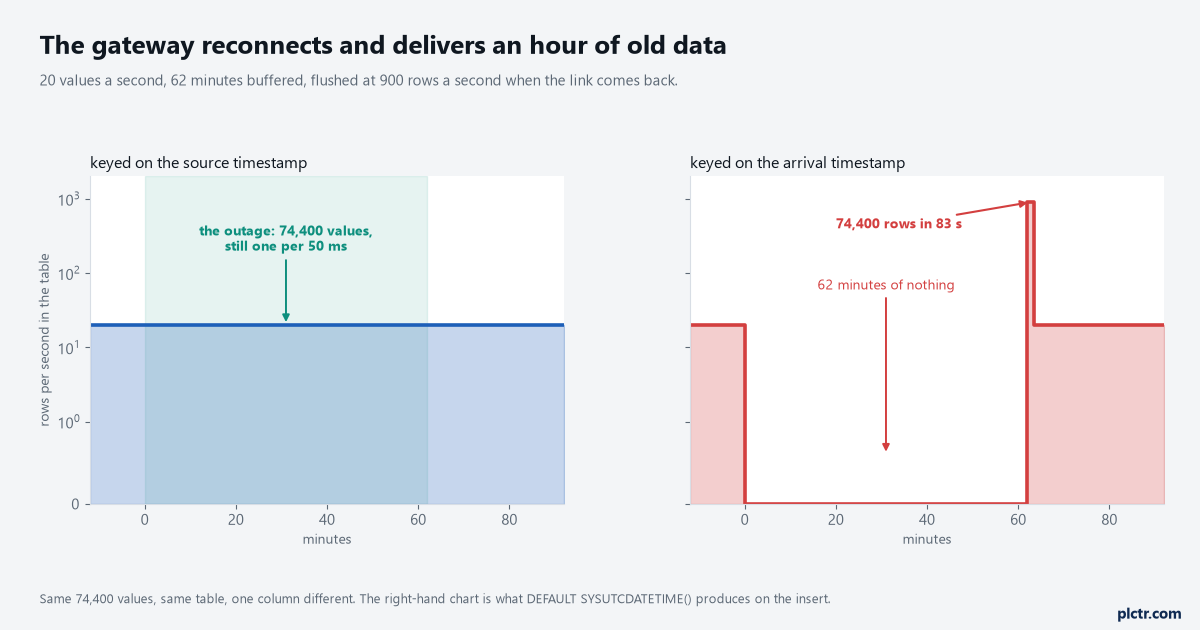
Same rows, same table, one column different. The chart on the right is what an operator is shown when the connector writes the arrival time and nothing else.
Sparkplug B thought about this and gave it a name.
Every metric in a Sparkplug payload carries its own timestamp, and the metric also carries an optional boolean called is_historical. The specification’s description of it is precise: it denotes whether this metric represents a historical value, for batching, store and forward, or sending local backup data during network communication losses, and it says the message should not be considered a real time or current value. That single flag is the protocol telling a host application not to update a live display from these values while still filing them at their real time. There is a sibling flag, is_transient, for metrics a host should watch but never put in a historian, and the same section of the specification requires that all Sparkplug timestamps are in UTC and that every edge node and host application keeps its clock accurate by NTP or equivalent. There is even a case where the specification overrides its own payload timestamp: because a death certificate may be published by the broker on the edge node’s behalf as a will message, its payload timestamp does not represent when the node actually went offline, so a host must mark the node offline using its own system UTC time instead. That is a specification being honest about which clock knows what, which is the discipline this whole page is asking for. The MQTT and Sparkplug gateway article covers the payload and the birth certificates these flags live in.
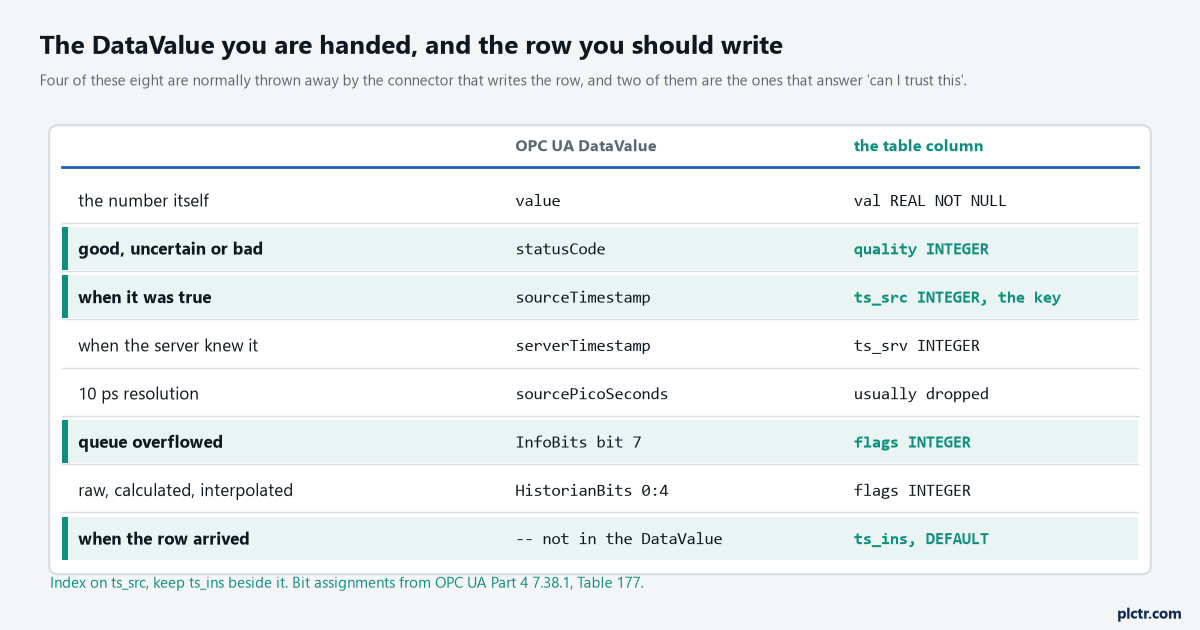
Four of these eight are normally discarded by the connector that writes the row, and two of the four are what answer “can I trust this value”.
Two machines whose clocks differ
The stamps can all be right and the report still wrong, if the clocks behind them are not the same clock.
An ordinary uncorrected crystal in a PC drifts around 35 parts per million, which is 9.1 seconds after three days and 91 seconds after a month. Take a transfer whose outfeed jams and a packer 30 metres downstream that stops 0.4 seconds later. Machine A’s collector stamps the jam 09:14:31.2 and machine B’s, three days without an NTP server, stamps the stop 09:14:22.5. Sorted on the stamp, the report says the packer stopped first and the jam followed it by nearly nine seconds, which inverts cause and effect and points the investigation at the wrong machine. Nothing in either record is corrupt. Both collectors did their job. OPC UA’s own wording on redundant sources — that the clocks of the sources should be synchronized — is the general form of this, and it applies just as hard to two independent collectors as it does to a redundant pair.
So the rule is one clock per site, not one clock per machine.
Point every collector, every gateway and every controller that can be an NTP client at the same server, put that server where both zones can reach it, and log the offset rather than assuming it. The Pi timestamping article works through chrony, the controller side of that synchronisation and the daylight-saving trap that makes one hour a year ambiguous in local time — which is the other reason everything above is in UTC.
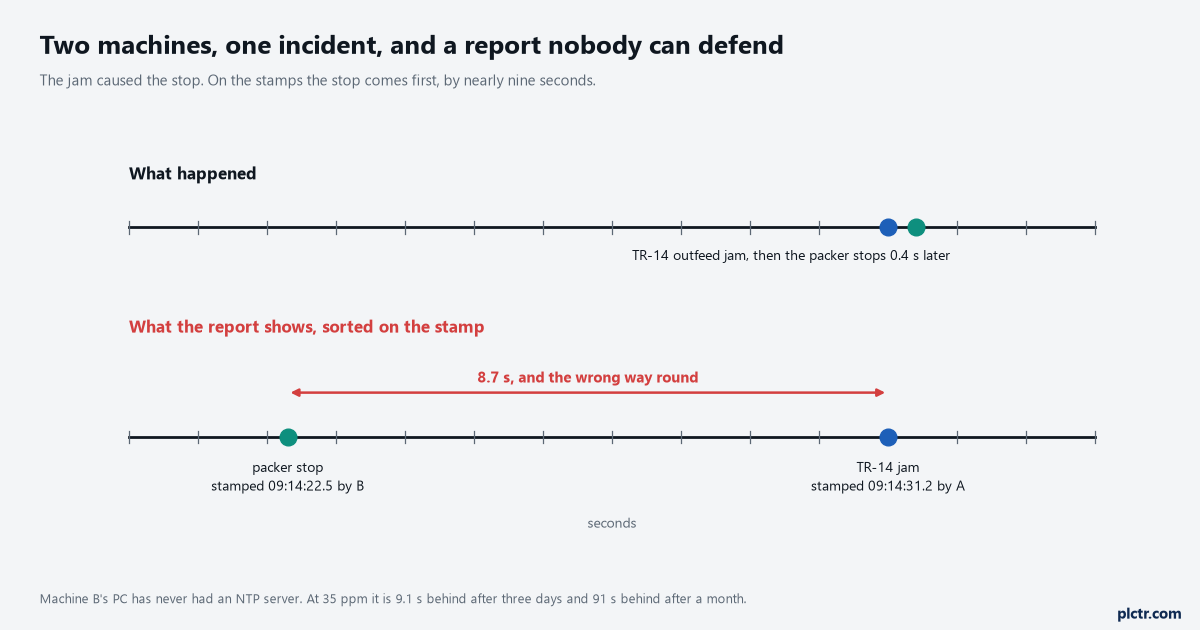
Both records are internally consistent. Neither collector made a mistake. The report is still wrong, and only a comparison against a third clock would ever reveal it.
Next step
Look at the table you already have and count the timestamp columns in it. If there is one, find out which of the four it holds, which usually means reading the connector’s configuration rather than the schema. Then add the missing one — an arrival column with a server-side default costs nothing and breaks nothing — and index the source column rather than the arrival one. After that, run a query that groups by the difference between them in one-second buckets over a week: a healthy path puts almost everything under a second and the tail tells you about the network, and a path that has ever buffered shows a cluster out at tens of minutes with the exact shape of the outage in it. If the two columns are always identical, your connector is stamping on arrival and calling it the source time, and every backfill you have ever had is filed under the wrong hour. The OPC UA tag to client path is where to change what the client asks for.