Seal_Temp has read 182.4 °C since about 04:00, the quality field next to it says Good, and the trend behind it is a flat line eleven hours long. The bagger has run four product changes in that time and the seal jaws are visibly hot. Nothing on the SCADA is in alarm, nothing in the server’s Event Log has a line for today, and the operator only mentioned it because the number looked too tidy.
This is worse than an error. An error tells you where to start.
Four things produce exactly this symptom, and from the client they are indistinguishable: the controller stopped answering and the server is handing out its last good read; the tag is in a scan group that was never activated; the client asked for a rate or a filter the server did not honour; or the value genuinely is not changing because nothing in the controller is writing it. The quality flag cannot separate them. The timestamp separates two of them and a heartbeat tag separates the rest, and the whole check takes about four minutes once you know the order.
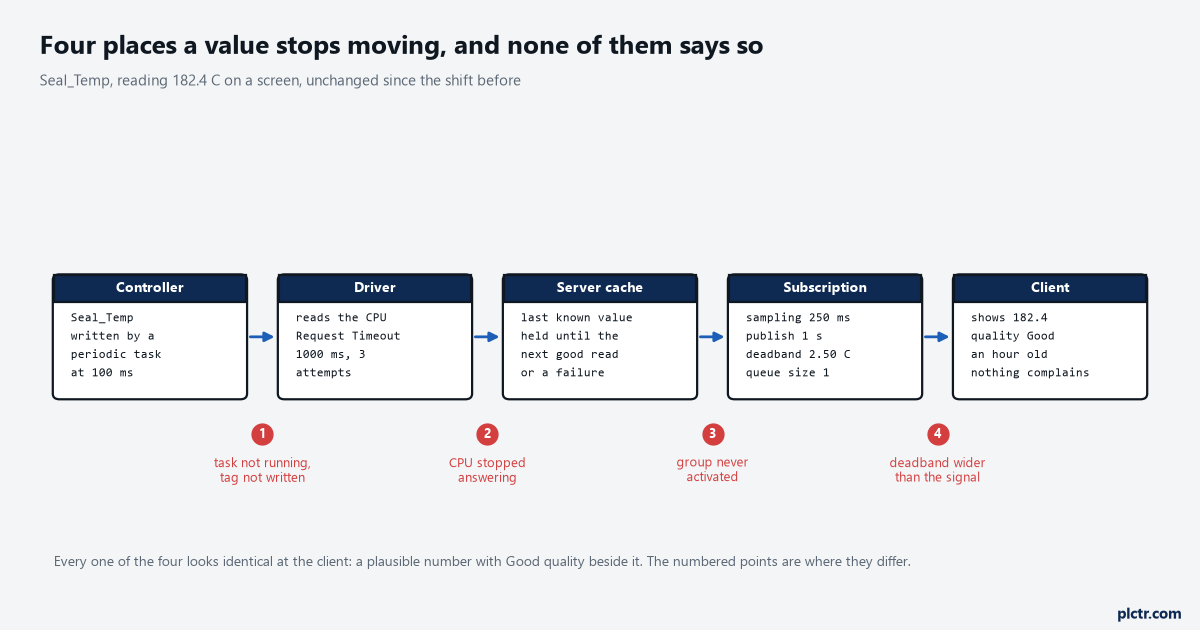
Four places a value stops moving. Every one of them arrives at the client as a plausible number with Good beside it, which is why the break points and not the display are where you look.
What Good actually claims, and what it does not
The Data Access specification is more careful about this than most implementations are, and one sentence in it settles the whole subject. Describing Uncertain_LastUsableValue, it says the status is not used to indicate that a value is stale, and that stale data can be detected by the client looking at the timestamps.
Quality is not a freshness flag. It never was.
Quality answers a different question: whether the value the server is holding was produced under normal conditions. A value read forty minutes ago under perfectly normal conditions still satisfies that, and that is not a bug in anybody’s implementation. What the specification does define is a status for the case everybody assumes Good is covering. Uncertain_NoCommunicationLastUsable means communication to the data source has failed, the value is the last one that had good quality, and it is uncertain whether that value is still current — and it adds that the server timestamp in this case is the last time the communication status was checked, with the time the value was last verified no longer available. That is the correct thing for a server to report over a held value. It is Uncertain, not Good.
Underneath it sit the unambiguous failures. Bad_NoCommunication is for a source that is defined but was never established and has no last known value at all, Bad_DeviceFailure is a failure in the device that generates the value, and Bad_OutOfService covers a source that is not operational. There is also a note in the same table worth knowing if you work with fieldbus devices: OPC UA requires a server to return a null value whenever the severity is Bad, so the fieldbus code Bad_LastKnown is mapped to Uncertain_NoCommunicationLastUsable instead. A last known value is never allowed to arrive wearing Bad.
So the ladder is Good, then Uncertain with a reason, then Bad with a reason, and a well-behaved server walks down it as a link dies. The gap you fall into is the interval before the server has decided the link is dead, and that interval is longer than people think — which is cause number one.
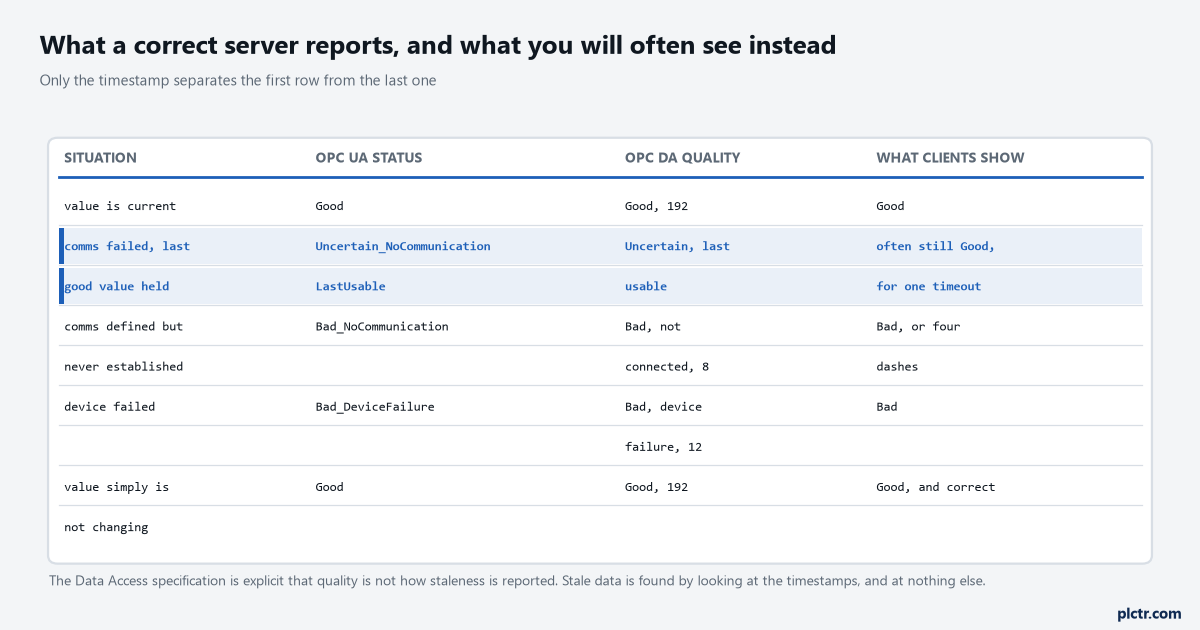
The first row and the last row carry identical status and identical quality. Only the timestamp tells them apart, which is the specification’s own advice rather than a workaround.
Cause one: the controller stopped answering
A 1756-L83E can stop answering CIP on port 44818 without dropping a single ping.
There is a window after a controller goes quiet during which nothing at all is reported, and it is set by three numbers on the device’s Timing page.
Connect Timeout governs opening the socket, with a valid range of 1 to 30 seconds and a default that is usually 3. Request Timeout is how long the driver waits for an answer to a request, 50 to 9999 ms, usually 1000 by default. Attempts Before Timeout is how many times it asks before calling the request failed, 1 to 10, usually 3.
Multiply those and the arithmetic is uncomfortable: at the defaults a single failed read takes three seconds to become a failure, and the tag holds its old value throughout. On a slow serial link where somebody raised Request Timeout to 5000 ms and attempts to 5, it is twenty-five seconds. Nobody is watching a screen for twenty-five seconds.
Three seconds of a held value, minimum, on a link nobody has tuned.
Auto-Demotion is the feature that shortens this, and it is off by default. Enable Demote on Failure and set Timeouts to Demote — 1 to 30 successive failures, default 3 — and Demotion Period, 100 to 3,600,000 ms with a default of 10,000. The behaviour is worth quoting because it is the behaviour you want: during the demotion period no read requests are sent and all data associated with those read requests is set to bad quality. That is the server telling the truth, on purpose, within a bounded time.
There is a second reason to turn it on and it has nothing to do with quality. A device that is not answering ties up the channel’s turn while it times out, so every other device on that channel is slowed by a dead one. Demoting it takes it out of the rotation, which is one more argument for one device per channel and for enabling this on every device you create.
Turn it on when you create the device, not after the first incident report.
Two tags tell you this is what happened. The device’s own _AutoDemoted returns true while it is off-scan, and the channel’s _Statistics._FailedReads climbs — the manual is specific that this count is only incremented after the channel has failed the request based on the configured timeout and retry count, so a rising _FailedReads is a real failure and not a retry.
And one line in the Event Log: device not responding. If that line is there and the value on screen still says Good, your client is caching, not your server.
Cause two: it was never scanned at all
This one produces a stale value with no error anywhere, ever, because from the server’s point of view nothing has gone wrong.
Four settings will do it and they are worth knowing as a set, because on a plant you will meet all four eventually. Data Collection on the device can be disabled, in which case communications are not attempted, the data is marked invalid to a client and writes are refused — that one at least shows as bad and somebody complains. Scan Mode set to Do Not Scan, Demand Poll Only stops all periodic polling and, the manual is explicit, does not even perform a read to get an item’s initial value when the item becomes active; from then on it is entirely the client’s job to poll, by writing the device’s _DemandPoll tag or by issuing explicit reads. Initial Updates from Cache is subtler and produces a value that looks completely real: it lets the server provide the first update for a newly activated tag reference from stored data rather than reading the device, provided the new reference shares the same address, scan rate, data type, client access and scaling as one it already has. Open a screen, get an instant plausible number, and it came out of memory rather than off the wire. Its default is disabled and on most projects it should stay disabled. The fourth is on the client side and is by some distance the most common of the four. An OPC group that is not active, or a UA monitored item whose monitoring mode is set to Disabled or to Sampling rather than Reporting, produces no updates at all while the item still browses, still holds a value and still shows a quality. Somebody set it that way during commissioning to take load off a struggling server, meant to put it back, and did not.
None of those four writes a single line to any log.
The test for all four is the same. Reset the channel statistics, wait ten minutes and look at _SuccessfulReads. On this line the Bagger sits alone on channel CLX_Line1 with 684 referenced tags at 250 ms, so ten minutes should put tens of thousands of reads on that counter; if it reads zero, nothing is being asked of the 1756-L83E at all. Put a device on a channel with two others and the same counter tells you nothing, because the other two keep it climbing.
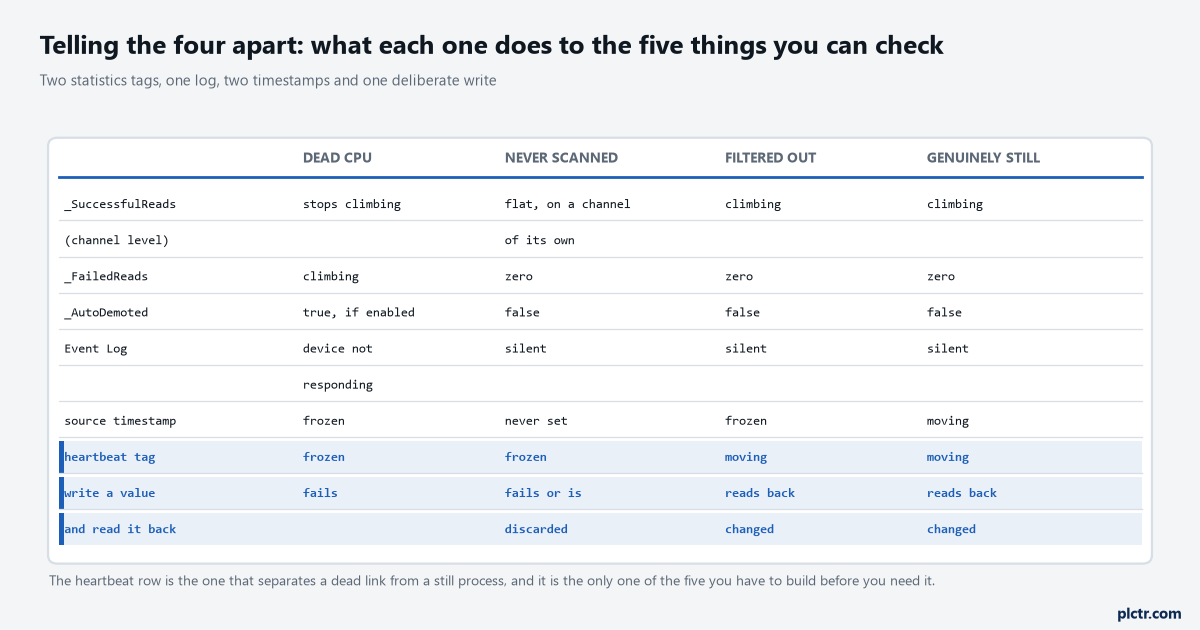
The table to work down in order. The heartbeat row is the only one that separates a dead link from a process that is genuinely holding still, and it is the only one you have to build in advance.
Cause three: the rate or the filter you asked for is not what you got
Ask for 100 ms, be given 1000 ms, and never be told. That is legal behaviour.
A client does not get to decide how often it is updated, and in both classic OPC and OPC UA the server is entitled to say so quietly.
In UA the mechanism is explicit and it is in the specification rather than in anybody’s release notes. The sampling interval is a best-effort figure, servers are expected to support only a limited set of intervals, and where the exact interval requested is not supported the server assigns the most appropriate one and returns it as the revised sampling interval. Ask for 100 ms, get 1000, carry on believing you are on 100 ms because your client never showed you the revised value.
The specification goes further, and this is the sentence that explains half of these complaints. In many cases the server provides access to a decoupled system and has no knowledge of the data update logic, so even though it samples at the negotiated rate, the underlying system might update the data at a much slower rate, and changes can only be detected at that slower rate. A MinimumSamplingInterval attribute is where a server declares that, if it declares it at all.
Two clocks that were never synchronised, neither of them wrong.
On the classic side the equivalent is Request Data No Faster than Scan Rate, which caps whatever the client asks for, and the asymmetry from the previous article in this batch: raising that value applies immediately, lowering it does not apply until every client has disconnected.
Then there is the filter, which is the cause with the best paper trail of the lot. The server manual carries a compliance setting called Ignore Deadband for Cache Reads, and its description names this exact symptom: for some OPC clients, passing the correct value for deadband causes problems that may result in the client having good data even though it does not appear to be updating frequently or at all. That sentence is in a vendor manual, describing a stale value with Good quality, as a known configuration outcome.
And the ordinary version of the same thing needs no compliance setting. A PercentDeadband is a percentage of the EURange, so a 1% band on a tag scaled 0 to 250 °C is 2.5 °C, and a seal temperature that swings 1.8 °C either side of setpoint will never pass it. That is exactly what the deadband arithmetic produced on this same machine: one notification in an hour, which is the initial value and nothing after it.
A deadband wider than the signal is a configured lie, and it is a very easy one to configure.
Cause four: the value really is not changing
This is the answer to reach last, and the one people assume first.
Sometimes the link is perfect and the number is correct, and this is the answer you want to reach last rather than assume first.
The controller-side checks are quick. Is the task that writes the tag actually running — a periodic task that has been inhibited, or a continuous task that has stopped, will leave every tag it owns holding its last value with the controller in Run. Does anything write the tag at all? Cross-referencing the tag in Studio 5000 answers that in ten seconds and answers it definitively, and a tag written only by a routine that is never called looks identical to a tag nobody has ever written.
Then there is the one that belongs in this article for completeness and that I have only seen twice, both times after a factory acceptance test. A device left in Simulation Mode does not talk to the controller at all, yet the server continues to return valid OPC data and treats all device data as reflective, so whatever is written to it reads back. Good quality, plausible values, a screen that responds correctly to every write an operator makes, and not one byte on the wire. The only sign is the read-only _Simulated tag, which is why it belongs on a diagnostics screen from day one.
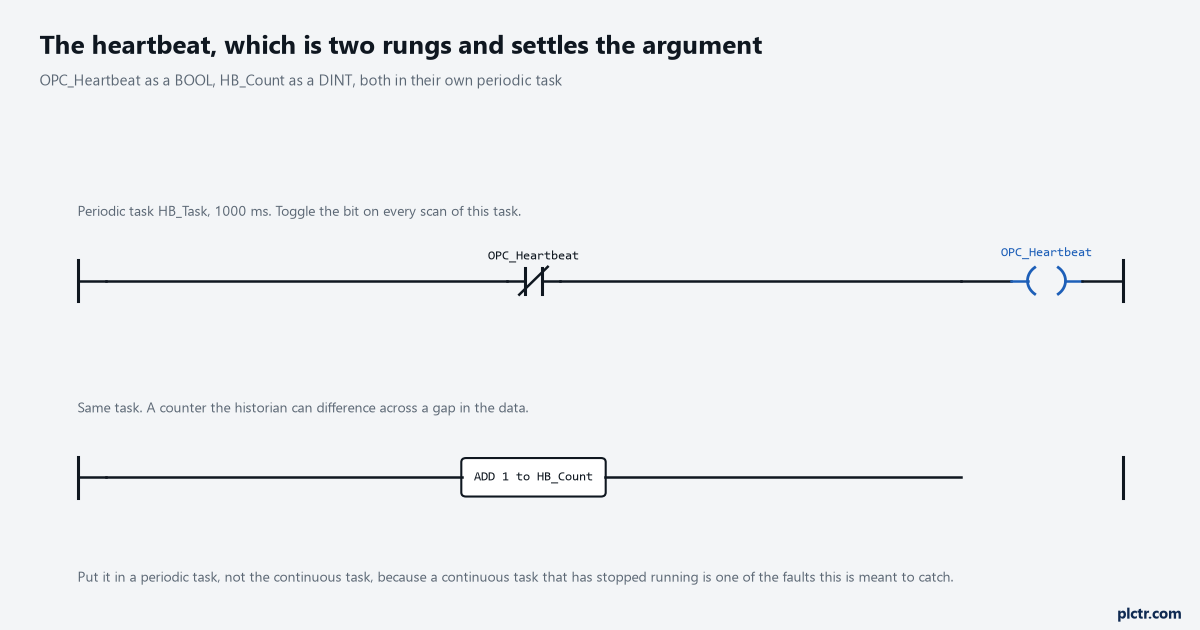
Two rungs. Put them in a periodic task rather than the continuous task, because a continuous task that has stopped running is one of the faults this exists to catch.
The heartbeat, and why it is two rungs
Fifteen minutes at commissioning against an afternoon at three in the morning.
Everything above is diagnosis after the fact. The heartbeat is the thing that makes the diagnosis take ten seconds instead of an afternoon, and the reason to write about it is that almost nobody fits one until the second time they get caught.
It is a BOOL toggled by a normally-closed contact of itself, in a periodic task at 1000 ms, written nowhere else in the program. Add a DINT incremented in the same task if you want the historian to be able to difference across a gap and say exactly how many seconds of data are missing. Cross-reference both tags afterwards and prove that nothing else writes them, because a heartbeat that some other routine also drives proves nothing at all.
The periodic task matters. A heartbeat in the continuous task cannot report a stalled continuous task, which is one of the four things you are trying to catch.
Now look at the two tags side by side. A frozen process value with a moving heartbeat means the link is fine and the process is still or the filter is eating it, which sends you to causes three and four. A frozen process value with a frozen heartbeat means the path is broken somewhere between the task and the client, which sends you to causes one and two. That is the whole diagnostic tree collapsed into one glance, for about fifteen minutes of work on the day the controller is commissioned.
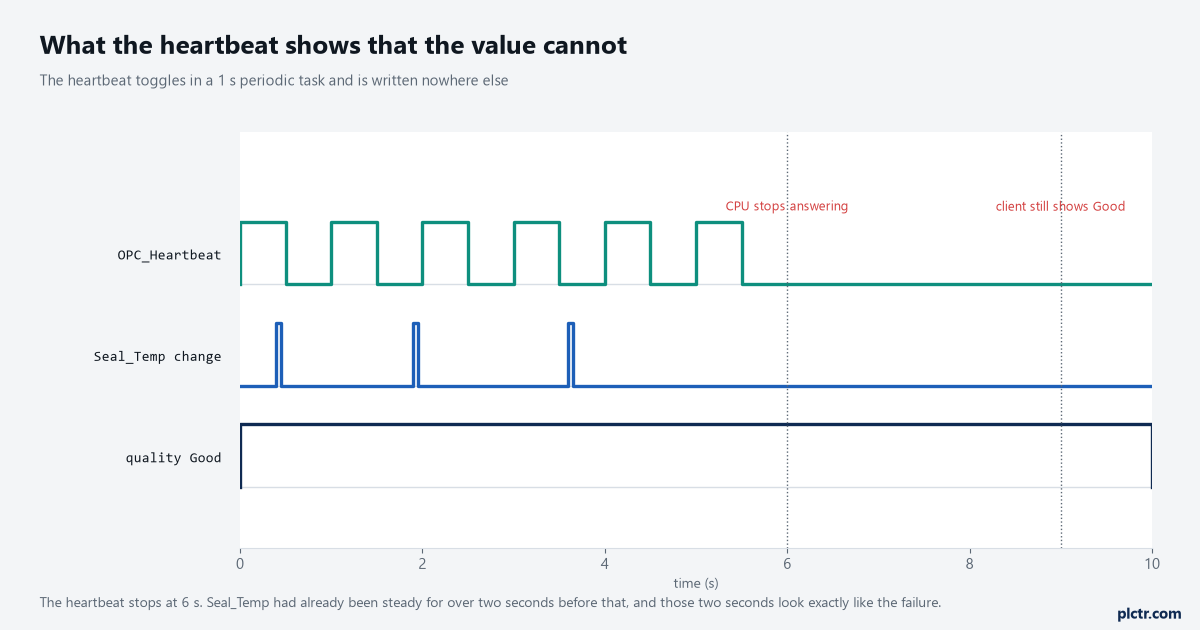
The heartbeat stops at 6 s. Seal_Temp had already been steady for over two seconds before that, and those two seconds look exactly like the failure until the heartbeat is there to say otherwise.
The dead end everybody starts with
The first thing somebody does is ping the controller. It answers, and forty minutes go by before anyone questions that result.
It answers. That result is worth almost nothing and it costs forty minutes.
A ping proves the network stack is alive and proves nothing about CIP. A controller with a faulted communication module, a controller whose connection resources are exhausted, and a controller that has closed an idle connection on the inactivity watchdog all answer a ping perfectly while refusing every read. So does a controller in Program mode, for that matter, which brings the whole line to a halt without a single OPC error.
The second dead end is restarting the OPC server, which usually does fix it, and that is exactly the problem. Everything is re-read, the value updates, the cause is gone, and the same fault comes back in three weeks with no more information than it had the first time. Take the two statistics readings before you restart anything.
What to do before this happens to you
Put three things on a diagnostics screen this week and none of them takes an hour: the device’s _AutoDemoted and _Simulated system tags, the channel’s _SuccessfulReads and _FailedReads with diagnostics enabled while you are looking, and a heartbeat from each controller with its age displayed in seconds rather than as a raw value. An age in seconds is the version an operator can use, because “the heartbeat is 43 seconds old” is a sentence somebody will phone you about.
Then go and look at one analogue tag you already suspect. Read its EURange and its deadband, work out the band in engineering units, and compare that number with how much the signal actually moves in a shift. If the band is bigger, you have found it, and the trend you need to prove it belongs in the controller rather than in the SCADA that is lying to you.
And check the timestamps, since the specification says that is where staleness lives. Not the quality field. The timestamps.